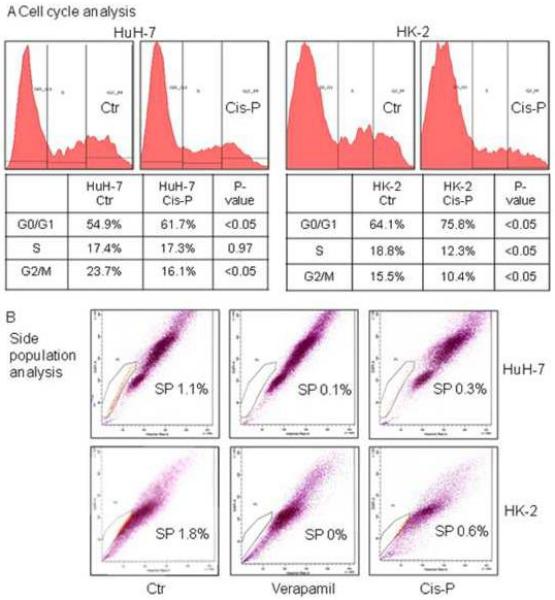
Figure 4. Cell cycle and side population analyses.

A. Shows cell cycle profiles in HuH-7 and HK-2 cells with or without Cis-P. The fractions in G0/G1, S or G2/M are given and indicated interference with cycling in both cell lines although the fraction in S was relatively more depleted in HK-2 cells. B. Both HuH-7 and HK-2 cells contained SP cell population as indicated by loss of these cells after treatment with verapamil, which characterizes Hoechst dye efflux in this cell population. After Cis-P, SP cells declined in HuH-7 as well as HK-2 cells, which indicated cytotoxicity in this relatively slower or noncycling cell population.
