
Fig. 3. Comparison of ICSS after treatment with vehicle + vehicle and either RTI-118 + cocaine (A) or U69,593 + cocaine (B).
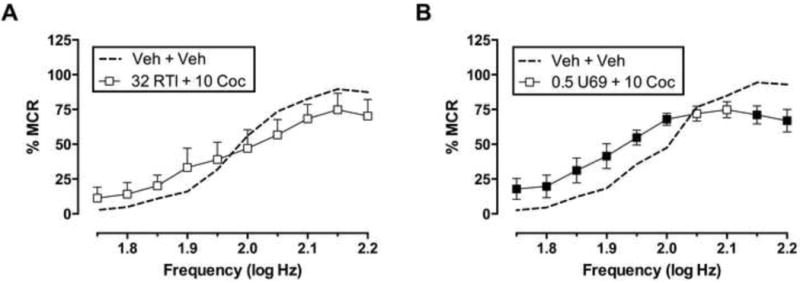
Abscissae: frequency of electrical brain stimulation in log Hz. Ordinates: percent maximum control reinforcement rate (%MCR). Treatments are indicated in legends, and drug doses are presented in units of mg/kg. Filled points represent frequencies at which ICSS rates after drug treatments were different from vehicle treatment as determined by two-way ANOVA followed by Holm-Sidak post hoc test, P<0.05. All data show mean ± S.E.M. for five (RTI-118 + cocaine) or six (U69,593 + cocaine) rats.