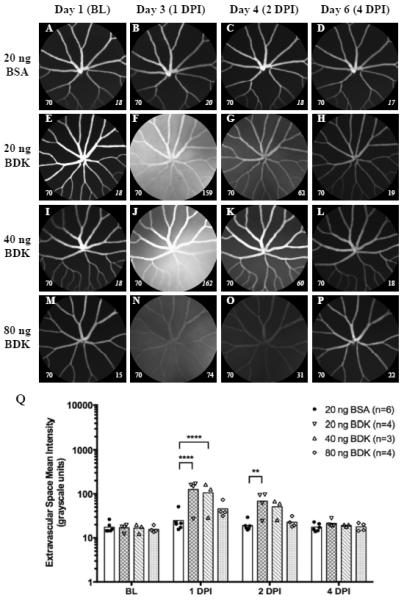
Figure 4.

Representative images (Fig. 4A–P) and graphical results (Fig. 3Q) from an experiment involving intraocular injections of BSA (20 ng, 0.8μl) as a control protein and BDK (20, 40 or 80ng, 0.8μl) in Tg(l-fabp:DBP-EGFP) zebrafish. Representative images from 20ng BSA and 20, 40 & 80ng of BDK can be observed in Figs. 4A–D, 4E–H, and 4I–L, respectively. One animal in the 40ng group died after baseline imaging. In this particular group of BSA treated animals (vs. the ones from Fig. 3), ASMI at 1 DPI was elevated relative to BL but not significant. Animals treated with BDK showed a significant response to treatment that could be easily observed at 1 DPI and moreover, the response carried over to 2 DPI. Leakage was observed in each treatment group but was significant only with 20 & 40 ng doses. This data also suggests an inverse dose response trend with BDK. This experiment shows the utility of this approach for the testing and screening of biological and chemical agents to study vascular permeability of the blood- retinal barrier. Data shown as a scatter plot with bars to indicate group time point means. (Image notations: Lower left # − camera sensitivity setting; Lower Right # - ESMI; normal style text- ESMI obtained with sensitivity set @ 70, italicized text- ESMI was corrected).
