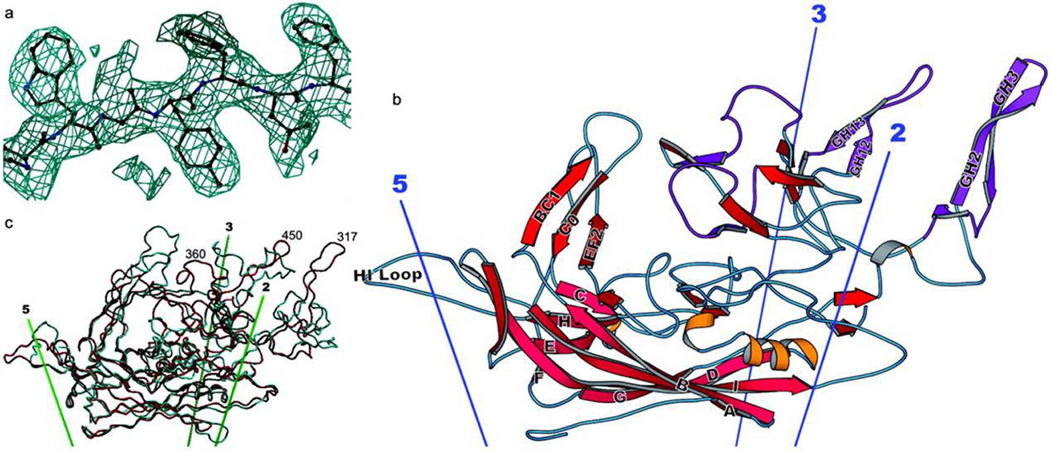
Fig. 1. Structure of the AAV-2 subunit and comparison with related structures.
(a) Experimental electron density for AAV-2. Phases for this 3-Å resolution electron density map are independent of the AAV-2 model, having been obtained by symmetry averaging and extension from a CPV model at 15-Å resolution. Density is clear and allows an unambiguous fitting of the chemical sequence throughout VP3. (b) Ribbon drawing of the AAV-2 subunit. The locations of the neighboring symmetry axes are shown. The β-barrel is on the inner surface of the capsid (pink) with strands of the two sheets labeled conventionally as A, B, I, D, and G, and C, H, E, and F. Loops are labeled according to the flanking strands—e.g., GH loop. Regions where the sequence differs greatest between the AAV serotypes are colored purple [122]. (c) Comparison of the backbones of AAV-2 (red) and canine parvovirus (cyan). The loop structure, which is responsible for many of the viral-host interactions differs substantially between AAV-2 and canine parvovirus, is largely absent from insect densoviruses (not shown). Reprinted with permission from ref 6.

