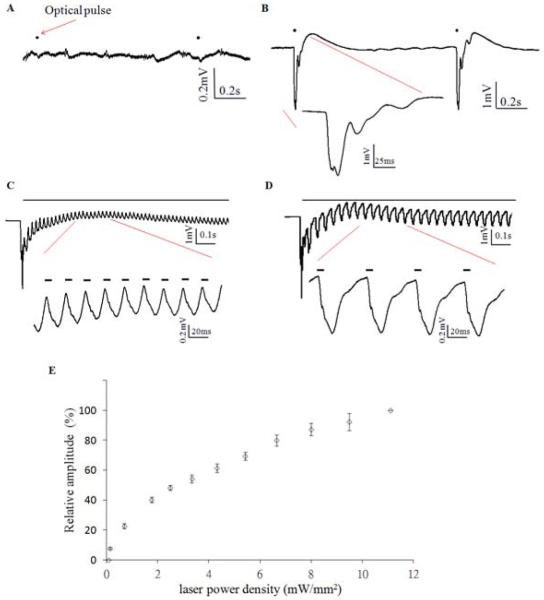
Figure 1.
Optical response to 473 nm blue laser in wildtype and thy1-ChR2 transgenic mice. A. In vivo neural activity trace in response to 1 Hz optical pulse train (black dot) in wildtype mice. B. Optically evoked potential induced by 1 Hz optical pulse train (black dot) in thy1-ChR2 transgenic mice. C. Optical response to 20 Hz optical stimulation (black line). Magnification shows the trace responding to the optical pulse (bold line). D. Optical response to 50 Hz optical stimulation. E. Relationship optically evoked potential (relative amplitude) and laser power density in 1 Hz stimulation.

