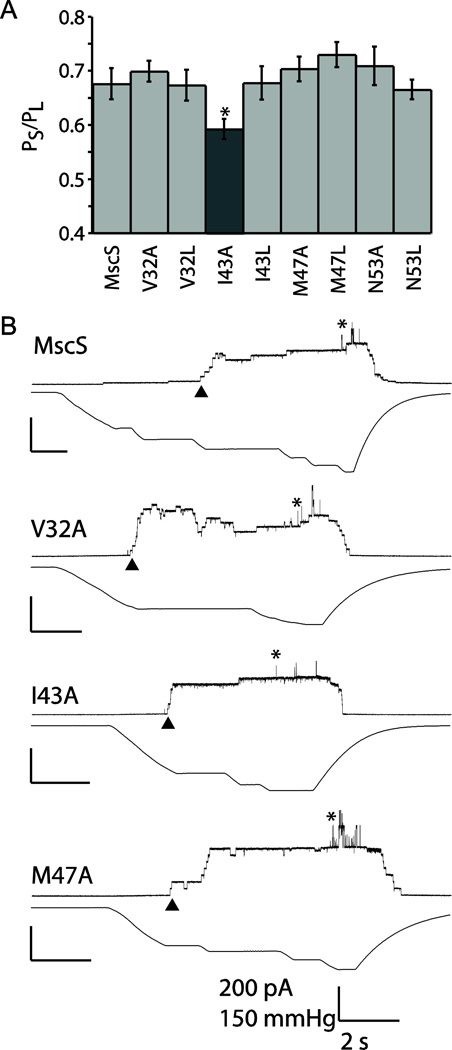
Figure 4.
Patch clamp analysis of wildtype and mutated MscS channels at +20 mV. A) Pressure threshold values for a selection of mutants. Error bars represent the standard error of the mean for 6 patches from a minimum of two independent preps. The dark gray bar indicates the construct that is statistically different from wild-type MscS as determined using a Student’s T-test (* = p < 0.05). B) Representative traces are shown for wildtype MscS and three additional mutants, showing wildtype behavior. For simplicity in patch traces channel openings are shown as upward inflections, MscS openings are indicated by ▲ and MscL openings are indicated with *. Scale bars represent 2 seconds on the X-axis and 200 pA and 150 mmHg on the Y-axis.

