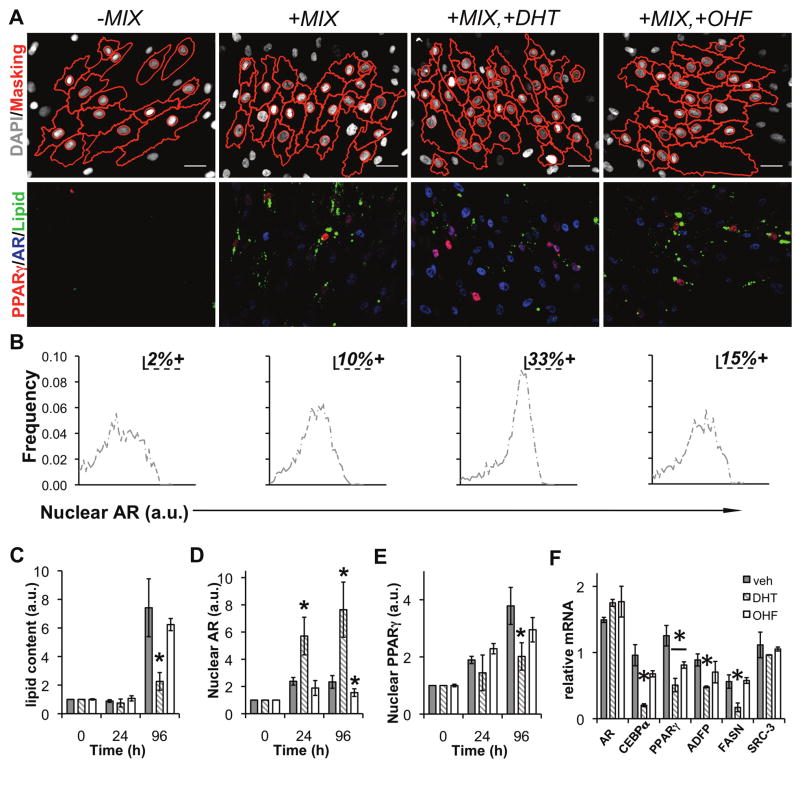
Figure 3.
AR activation suppresses human adipogenesis. (A) Images from human adipocytes differentiated for 96 h with the indicated ligand treatments, immunolabeled with antibodies to PPARγ (gray scale), AR (red), and stained with LipidTOX (Lipid, green), and DAPI. On the left-most panels, masks (red) generated by image analysis algorithms were overlaid onto the DAPI (gray scale) images to indicate cell and nucleus borders. (B) Percent AR-positive cells were defined by measuring the 90th percentile expression level for +MIX and applying that threshold to single cell distributions of AR for the other 3 treatments. The effect of androgens on the rate of lipid accumulation, nuclear PPARγ, and nuclear AR was determined by differentiation of human preadipocytes for the indicated time points in the presence of DHT, vehicle (EtOH), or OHF. HCA was used to quantify the induction of (C) lipid accumulation, (D) AR, and (E) PPARγ. In parallel, relative mRNA was determined for (F) AR, C/EBPα, PPARγ, ADFP, FASN, and SRC-3.

