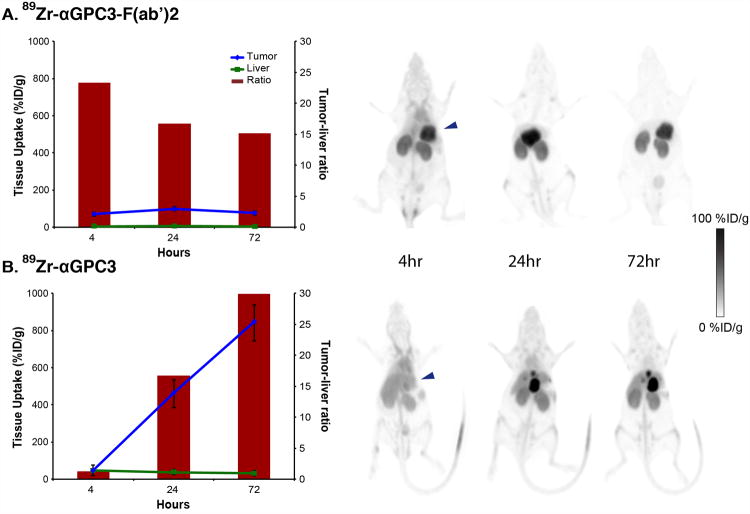
Figure 4.
Tumor-to-liver tissue uptake (line graphs), tumor-to-liver contrast ratios (bar graphs), and representative PET images in HepG2-bearing mice injected with 89Zr-αGPC3-F(ab′)2 (A) and 89Zr-αGPC3 (B). Signal saturation was allowed in 89Zr-αGPC3 animal images to allow comparison with 89Zr-αGPC3-F(ab′)2. (Data from B has been reprinted with permission of (9).)

