
Figure 8.
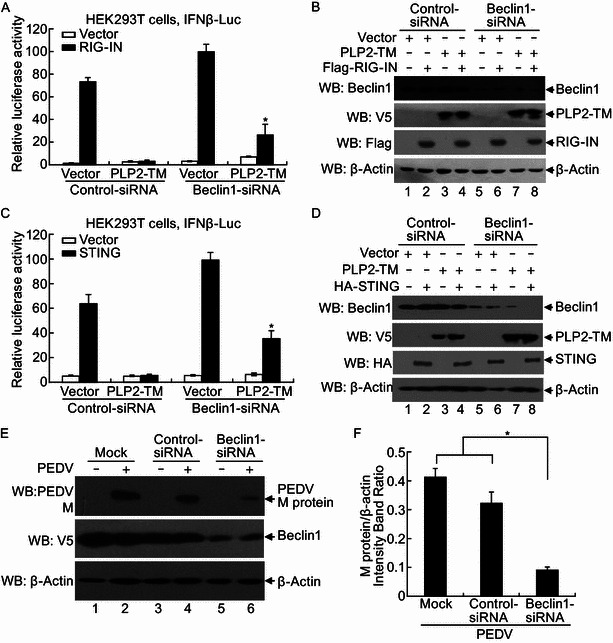
Beclin1 is required for the PLP2-TM negative regulation of IFN expression and contributes to coronavirus replication. (A, C) HEK 293T cells were mock transfected or transfected with control-siRNA, and Beclin1-siRNA at a concentration of 100 nmol/L for 24 h, and then the cells were transfected with IFNβ-luc reporter, pRL-TK, with expressing construct of RIG-IN (A) or STING (C) or empty vector and PLP2-TM for another 24 h. Cells were incubated for 48 h and firefly luciferase and Renilla luciferase activities were assayed. The results were expressed as mean relative luciferase (firefly luciferase activity divided by Renilla luciferase activity) with a standard deviation from repeated experiments carried out in triplicate. For statistical analysis, the data of Vector or PLP2-TM between Beclin1 siRNA and control siRNA were subjected to unpaired, two-tailed Student’s t test using the Microsoft SPSS 12.0 software, and a P value < 0.05 or less was considered statistically significant difference. (B and D) Proteins were extracted from the cells in Fig. 8A (B) or Fig. 8C (D) and analyzed using Western blotting with an anti-Beclin1 antibody to visualize Beclin1 proteins (top panel) and anti-V5 antibody (second panel) to visualize the PLP2-TM construct expression. Anti-Flag (B) and anti-HA (D) antibodies were used to visualize RIG-IN and STING proteins (third panel). Beta-actin was detected using Western blotting as protein loading control (bottom panel). (E) Beclin1-siRNA reduces PEDV replication in Vero cells. Vero cells were transfected with either Beclin1 siRNA or control siRNA at a concentration of 100 nmol/L for 24 h, and then the cells were treated by PEDV at a multiplicity of infection (MOI) of 0.1 for another 24 h. Cells were incubated for 48 h and the M protein expressions were assayed using Western blotting assay. (F) The optical density of M protein band in Fig. 8E was measured by densitometric analysis using ImageJ software and then the ratio of M protein/β-actin was calculated. For statistical analysis, the data between Beclin1 siRNA and control siRNA or mock control were subjected to unpaired, two-tailed Student’s t test using the Microsoft SPSS 12.0 software, and a P value < 0.05 or less was considered statistically significant difference