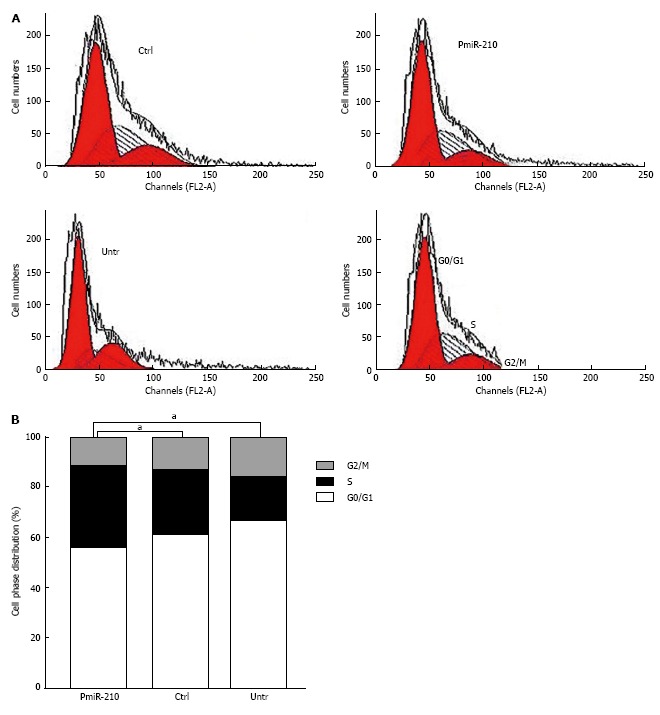
Figure 3.

S-phase arrest in miR-210 up-regulated radioresistant oesophageal squamous cell carcinoma cells. A: Flow cytometry was used to determine the distribution of the cells according to the phases of the cell cycle. All of the cells were uni-irradiated at 6 Gy and analysed 24 h later. The experiments were performed in triplicate. PmiR-210: Transfected with pmiR-210. Ctrl: Transfected with a nonsense sequence. Untr: Untreated; B: Histogram showing the cell cycle distribution of the cells. The fractions of cells in S phase were compared. aP < 0.05, pmiR-210 vs Ctrl or Untr.
