
Figure 6.
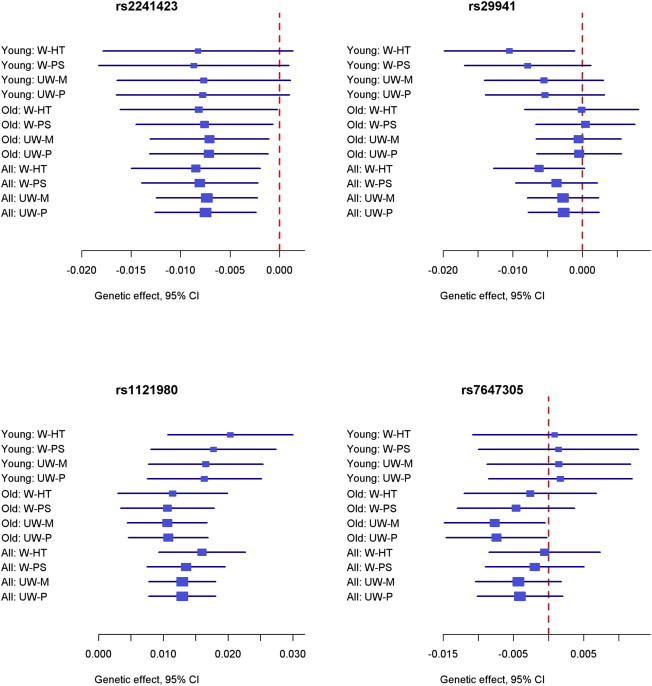
Forest Plots for Four Known BMI Loci in the HCHS/SOL
The effect estimates and 95% confidence intervals for weighted and unweighted methods with robust variance estimators are shown for the younger age group (young), older age group (old), and all individuals (all). The log-transformation was applied to BMI.