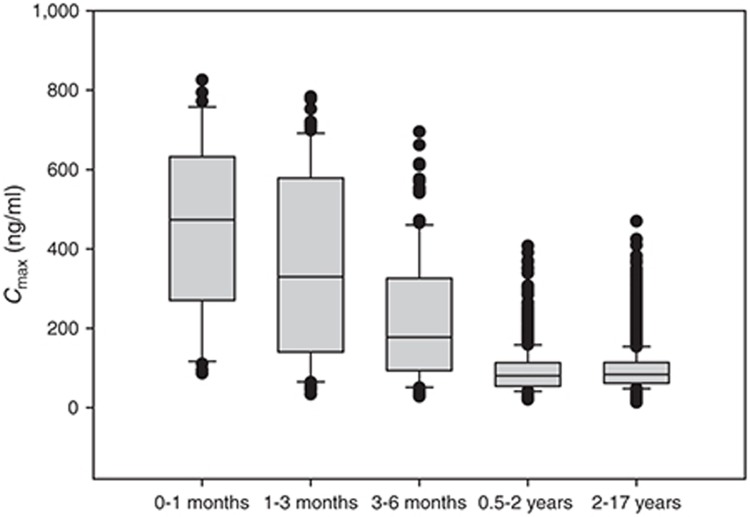
Figure 4.
A box whisker plot of the maximum concentration (Cmax) vs. age class for a hypothetical drug administered orally as a 1 mg/kg dose formulated as a suspension (0.1 mg/ml) to a pediatric population (n = 10,000; ages 0–17 years). The boundaries of the box indicate the 25th and 75th percentile with the line representing the median. Error bars indicate the 90th and 10th percentiles, and the symbols indicate outliers.

