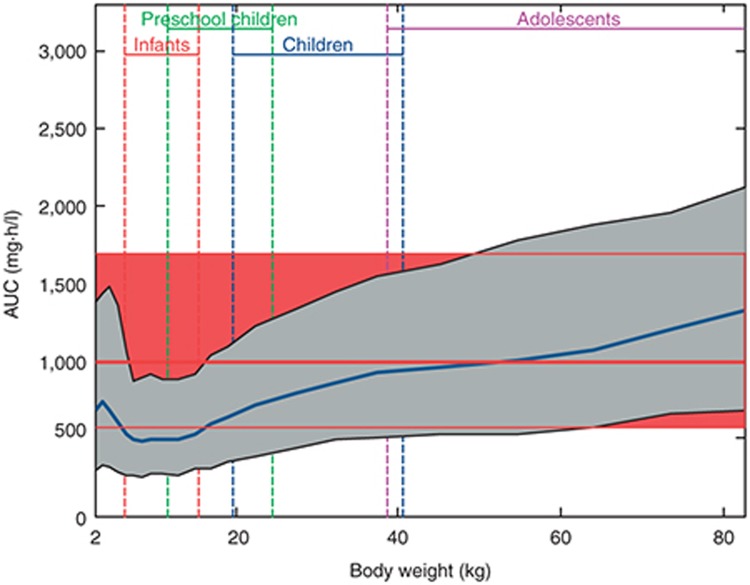
Figure 5.
Simulation of area under the plasma concentration–time curve (AUC) vs. body weight for rivaroxaban administered at 0.143 mg/kg body weight and formulated as an oral suspension as compared with the adult reference population. Simulated data of the pediatric population are represented as a geometric mean (blue line) and 90% prediction interval (gray shaded area). Simulated data of the adult reference population are represented as a geometric mean (thick red line) and 90% confidence interval (red shaded area in the background of the graph). Expected weight ranges for infants, preschool children, children, and adolescents are indicated. Taken from Willmann et al.10

