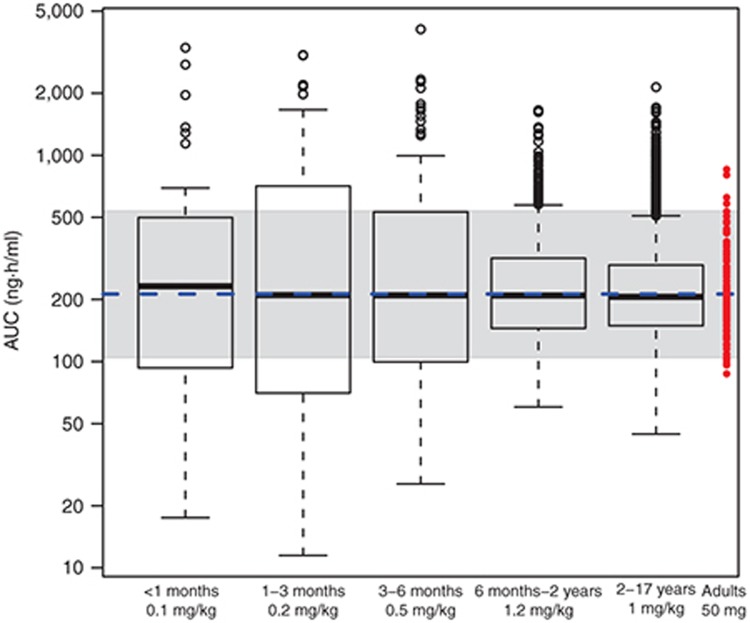
Figure 6.
A box whisker plot of AUCinf (y-axis) values as a function of age class for a given dose (in mg/kg) of hypothetical drug administered orally as a suspension to a pediatric population (n = 10,000; ages 0–17 years) that would reach equivalent AUCinf as a 50 mg tablet in adults. The box is the interquartile range (IQR) representing the 25th to 75th percentile. The whiskers represent the last point within 1.5 times the IQR of the 25th and 75th percentile. Circles represent all points above or below the whiskers. The blue dotted line is the geometric mean AUCinf, and the shaded area is the 90th percentile of adult values. Red dots are the adult individuals.

