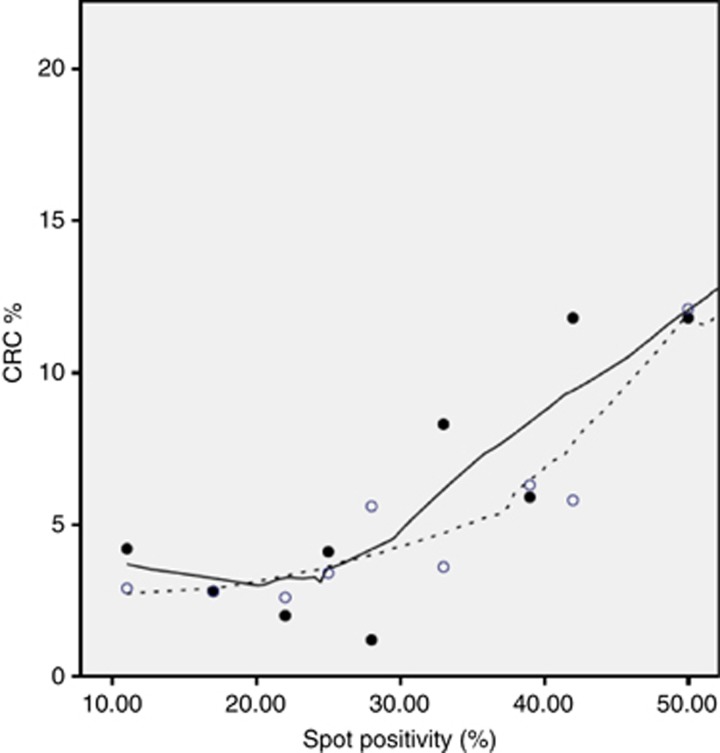
Figure 5.
A LOESS curve demonstrates the relationship between SP% and CRC detection rate for male (solid line) and female subjects (dotted line). The R2 linear correlation in males was 0.92. However the CRC% was ∼4% between an SP% of 11–25% and only above an SP% of 25% did the CRC% increase lineally. In females, the R2 linear correlation was 0.66. The CRC% remained below 5% from an SP% of 11–35% and it is only when the SP% was over 35% that the CRC% increased over 5%.

