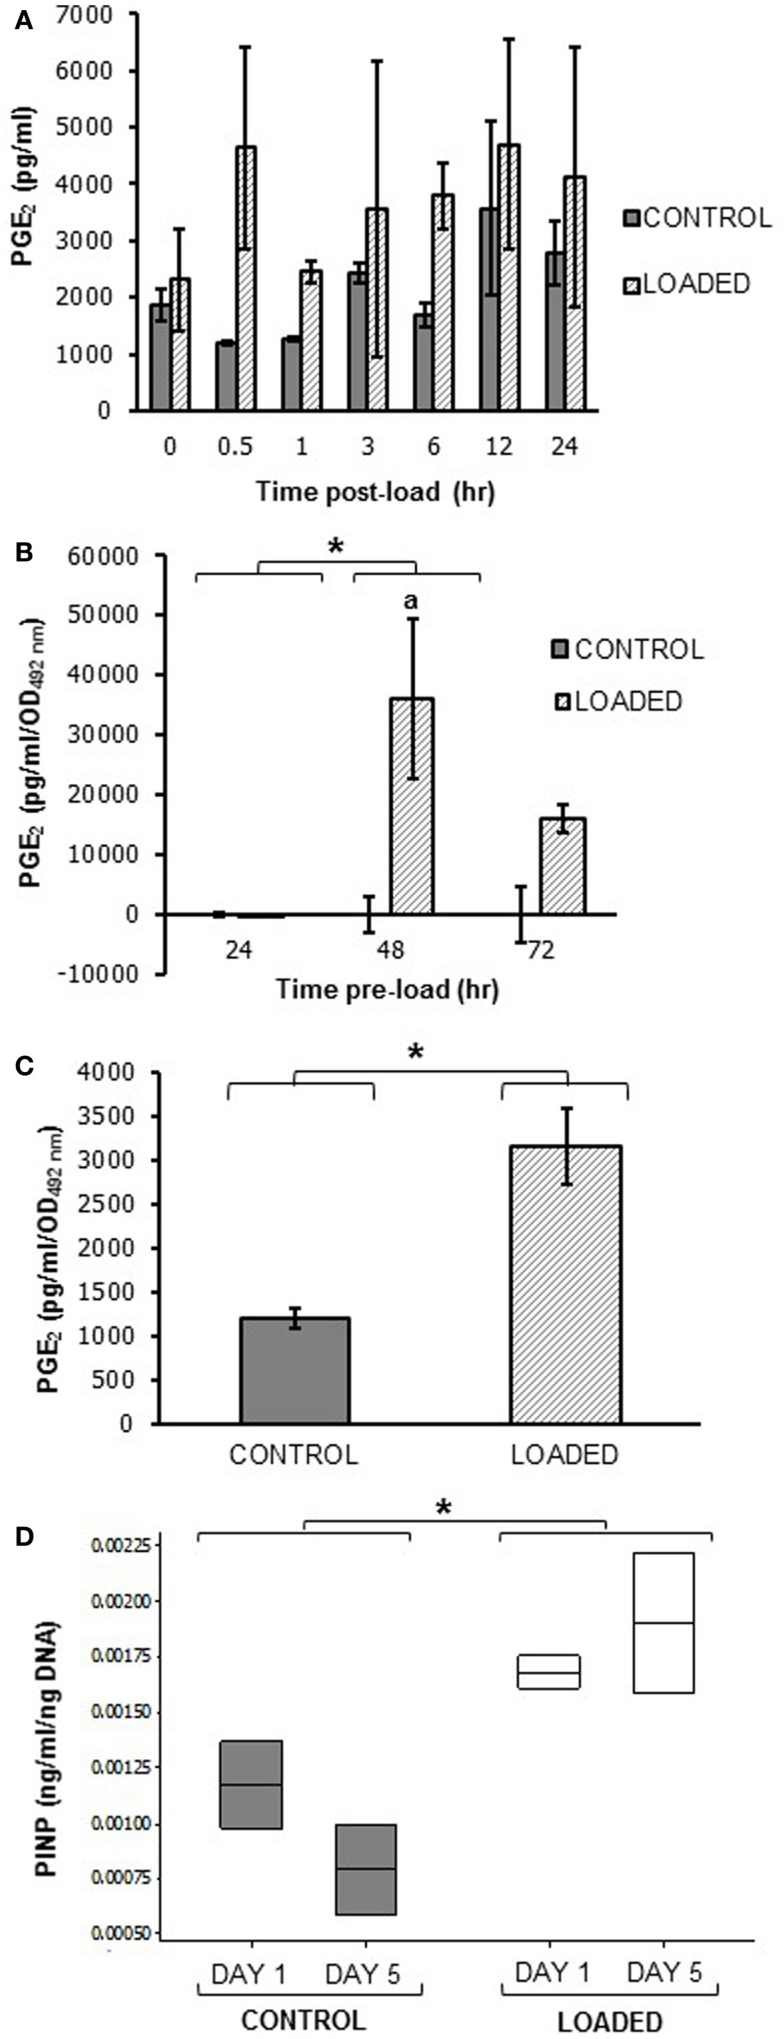
Figure 11.
Prostaglandin E2 and PINP release in mechanically loaded (5 min, 10 Hz, 2.5 N) 3D cultures by ELISA. Graphs showing PGE2 release from 3D osteocyte mono-cultures in a pilot experiment of 24 h cultures (A), categorized by time of culture (B), and 7 days cultures (C) at 0.5 h post-load unless other time-points are indicated. Data were normalized to the absorbance (OD492 nm) of LDH lysates (cell number) (B,C). (D) Boxplot of PINP release from control and loaded MLO-Y4/MC3T3-E1(14) 3D co-cultures cultures at day 1 and day 5 post-load, normalized to total DNA. *P < 0.05 as obtained by GLM, GLM of ranked data (B) or one-way ANOVA (C,D). Significant differences as obtained by GLM pairwise comparisons denoted by “a” with respect to 24 h loaded cultures (B). Data presented are from (A) one independent experiment, n = 2 or 3; (B) one (48–72 h cultures) or two (24 h cultures) independent experiments, n = 3; (C,D) one independent experiment, n = 2 or 3.

