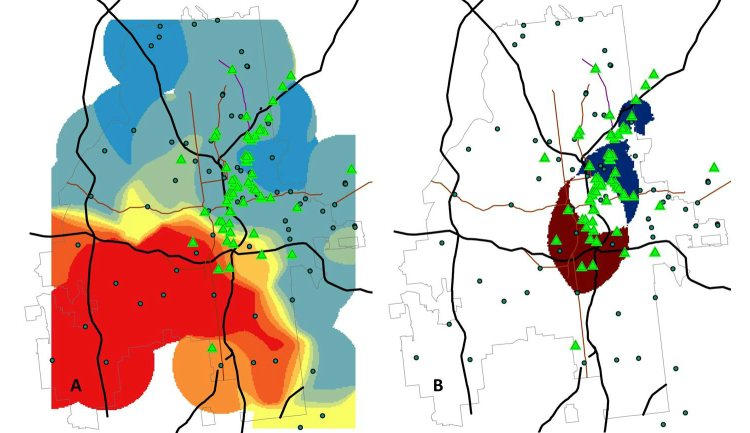
Figure 10.
Application of two density metrics to evaluate recruitment for HIV prevention studies in Atlanta, showing recruitment venues currently in use for two HIV prevention studies (green triangles). Panel A shows few recruitment locations in the southwestern part of Atlanta, where there are relatively more young black application users than white users. Panel B uses the formula (Density of young black users > mean+2 standard deviations) – (Density of young white users > mean+2 SD). Regions where the values of this equation are -1 (blue shading, indicating areas with extremes of density for young white but not young black users), 1 (red shading, indicating areas with extremes of the density for young black but not young white users), and 0 (white shading indicating areas that are either not extremes of either density or are extremes for both races) can then be compared to the locations of current recruitment venues.

