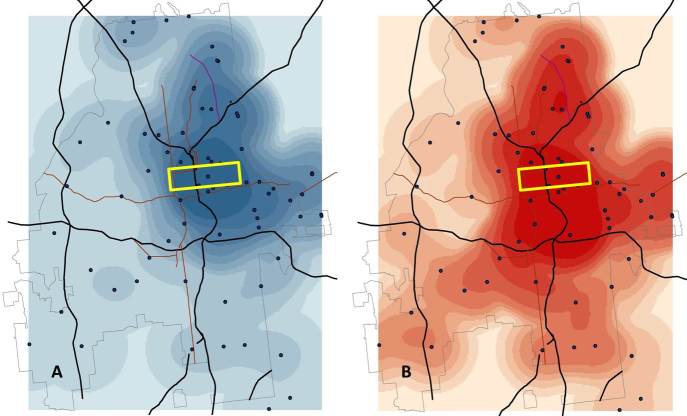
Figure 6.
Estimated density of white (A) and black (B) social network application users in Atlanta (gray outline), showing major highways (black lines) and roads (dark red lines) and highlighting the “Midtown” area of Atlanta (yellow rectangle); kernel densities estimated from sample data standardized to 1-mile circular radii and smoothed to 2 miles using a Gaussian smoother that concentrates the majority of the density at the sample point and averages over all adjacent data points within the smoothing radius.

