
Figure 4.
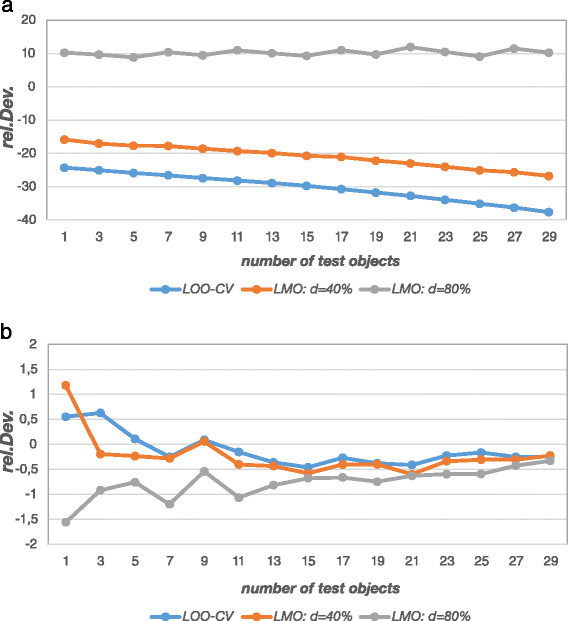
a-b - Relative deviation of prediction error estimates (TS-PCR, simulation model 2). Figure a shows that prediction error estimates from the inner loop of double cross-validation (ave.PE internal) deviate heavily from the theoretical prediction error (ave.PE theo) owing to model selection bias (downward bias) and sample size effects (upward bias for smaller construction sets). Prediction error estimates from the outer loop (ave.PE ) slightly deviate for small test sets while they converge to the theoretical prediction error for larger test sets (Figure b).