
Figure 6.
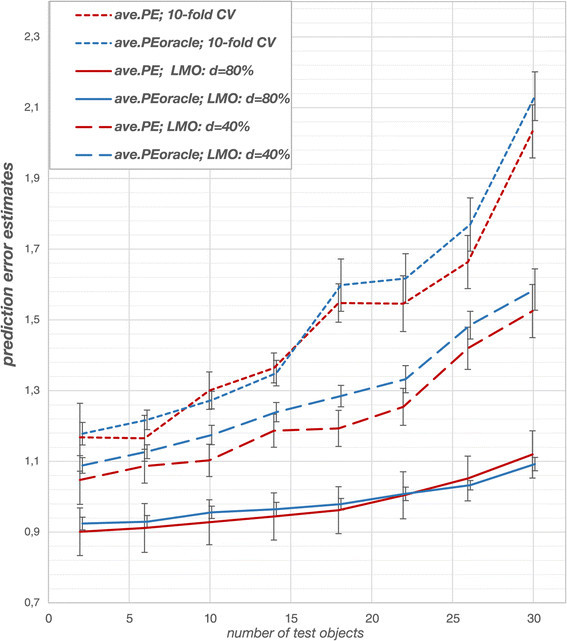
Solubility data: prediction error estimates for TS-PCR. For the solubility data, prediction error estimates from the outer loop agree with those obtained from the ‘oracle’ data. Deviations are attributed to random fluctuations (see standard deviations). Cross-validation design influences the performance of the derived models. Stringent CV -80% performs best while 10-fold CV performs worst because it overfits the data. The error estimates are averaged over 6 different partitions into ‘oracle’ data and data sample). Naturally, prediction errors increase for smaller training sets (i.e. larger test sets).