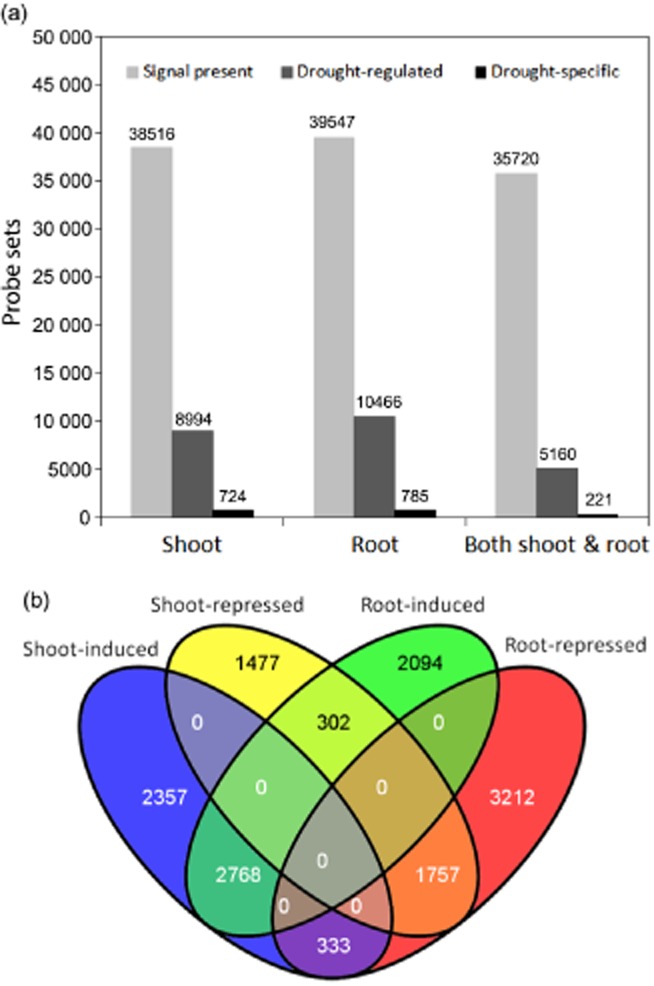
Figure 2.

Global transcriptomic changes during drought stress in Medicago truncatula. (a) Global number of probe sets that were regulated by drought or exclusively expressed under drought stress. (b) Venn diagram of drought-regulated genes in shoots and roots. The cut-off limit was twofold change and P-value < 0.05.
