
Figure 3.
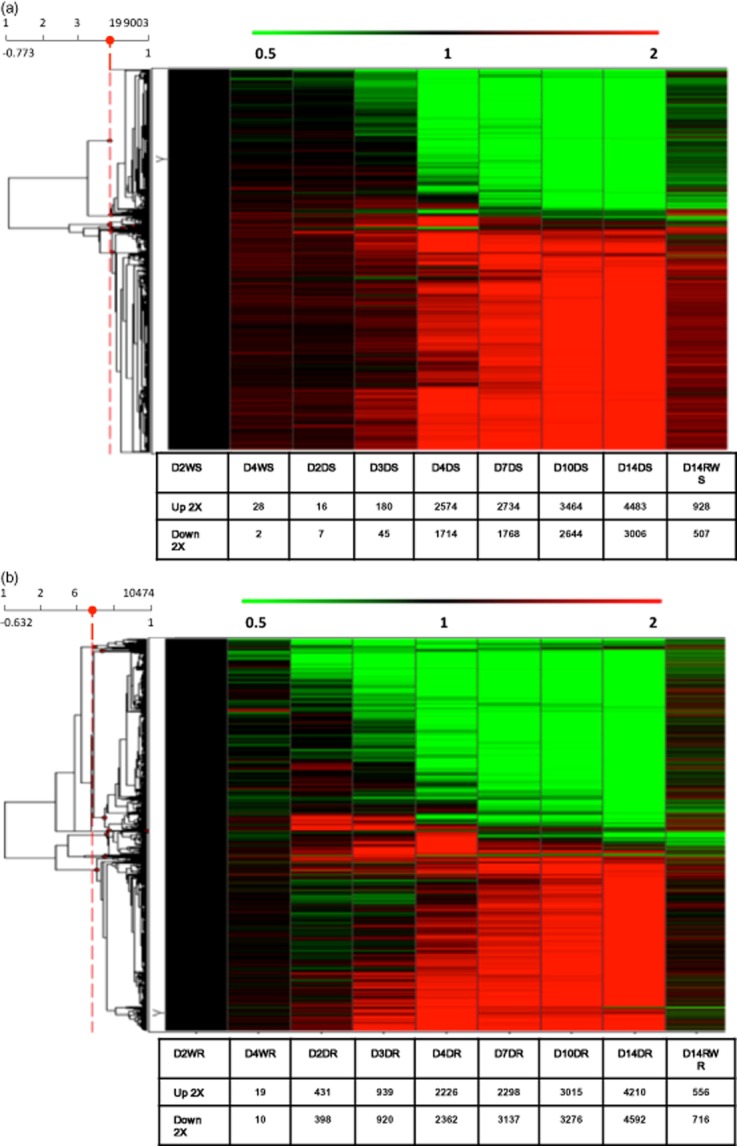
Hierarchical clustering analysis of drought-induced changes in gene expression in (a) shoots and (b) roots. Data from D14RWR were not used for clustering. D2W, 2-day well watered; D4W, 4-day well watered; D2D, 2-day drought; D3D, 3-day drought; D4D, 4-day drought; D7D, 7-day; D10D drought, 10-day drought; D14D, 14-day drought; D14RW, 1 d after rewatering; S, shoots; R, roots.