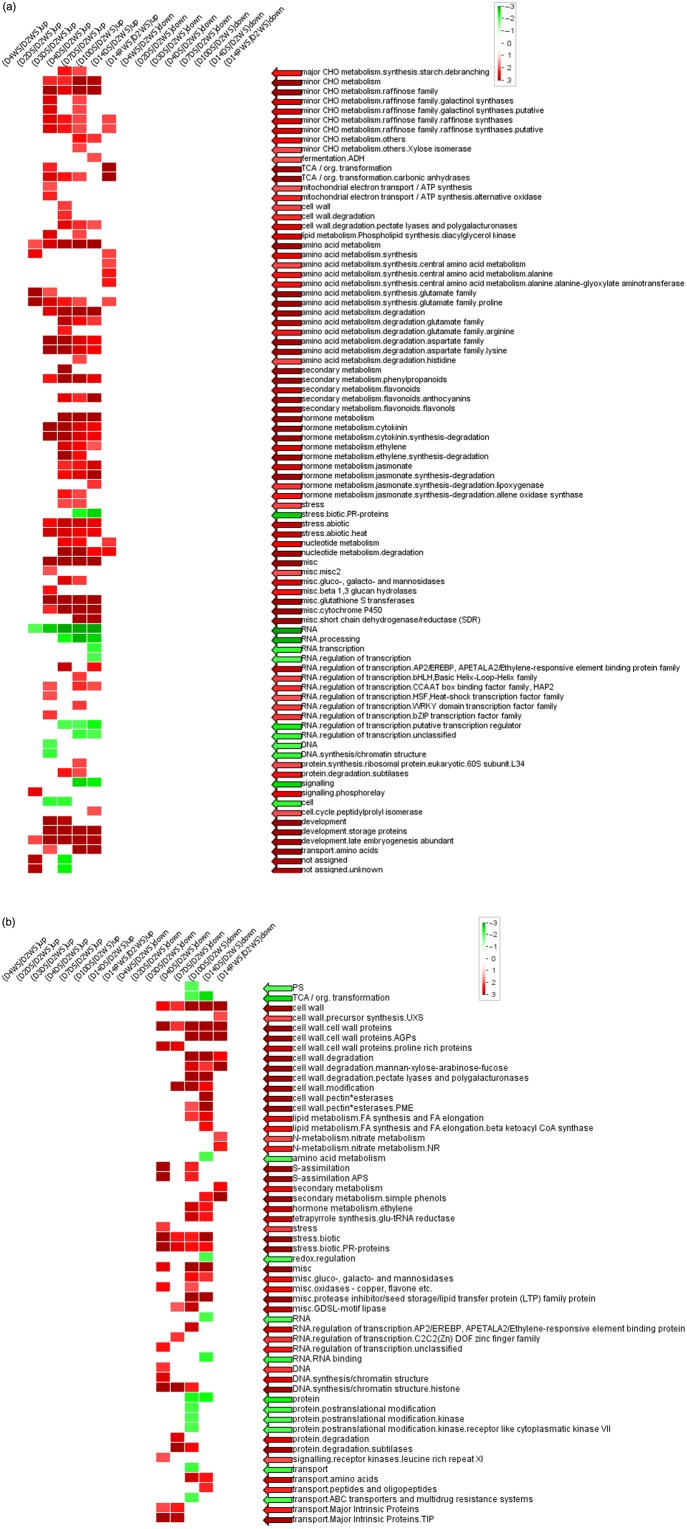
Figure 7.
PageMan analysis of genes whose expression in the shoots was strongly and positively (a) (correlation coefficient > 0.8, 1774 genes) or negatively (b) (correlation coefficient < −0.8, 3613 genes) correlated to Ψw. Log2-transformed ratios were used. Overrepresentation analysis was performed using Fisher's exact test and the cut-off log2 ratio was 2. D2W, 2-day well watered; D4W, 4-day well watered; D2D, 2-day drought; D3D, 3-day drought; D4D, 4-day drought; D7D, 7-day; D10D drought, 10-day drought; D14D, 14-day drought; D14RW, 1 d after rewatering; S, shoots.

