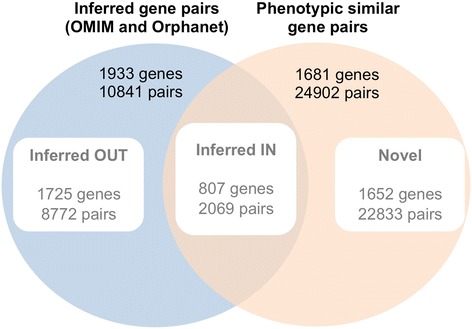
Figure 4.

Subsets of inferred and phenotypically similar gene pairs. Venn diagram showing the distribution of gene pairs between a dataset of inferred relationships (from the union of OMIM and Orphanet) and the phenotypic similarity gene network at a low level of confidence corresponding to the 98th percentile.
