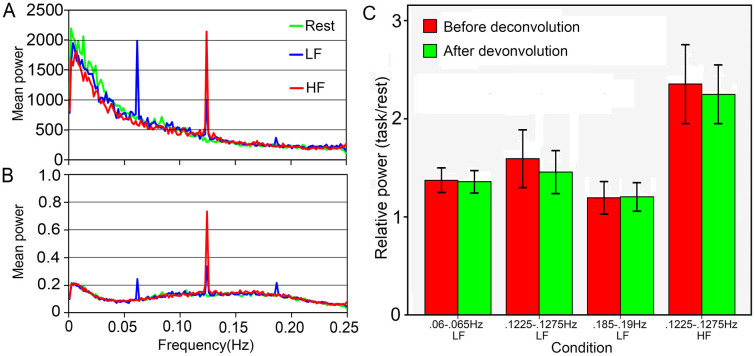
Figure 1. The grand-average of task evoked SSBRs at the whole brain level.
SSBRs are shown by the mean power at 0.0625 Hz, 0.125 Hz and 0.1875 Hz before (A) and after (B) HRF deconvolution. In a 0.005 Hz bandwidth, SSBRs were significantly induced at 0.06–0.065 Hz (p <0.001) and 0.1225–0.1275 Hz (p <0.001) frequency bands for the LF condition, and at 0.1225–0.1275 Hz (p <0.001) for the HF condition (C). There was no remarkable effect from HRF deconvolution (p >0.05). LF: lower frequency condition; HF: higher frequency condition; error bars represent the 95% confidence interval.

