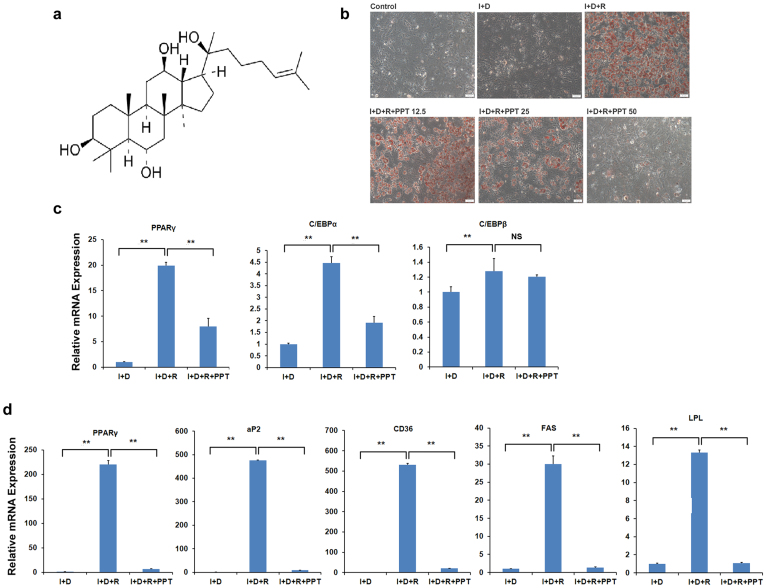
Figure 1. PPT inhibits 3T3-L1 adipocyte differentiation and adipogenesis related gene expression.
(a) Structure of PPT. (b) PPT suppresses 3T3-L1 adipocyte differentiation induced by differentiation medium. Differentiation medium includes 10 μg/ml insulin, 1 μM dexamethasone and 10 μM rosiglitazone. Oil red O staining of 3T3-L1 cells was performed on day 6. PPT was added to the medium at the beginning of induction of 3T3-L1 cells at the indicated concentration. (c) Real-time RT-PCR results of gene expression levels at day 0 in 3T3-L1 adipocyte. Cells were treated with PPT (50 μM) and differentiation medium after confluence for 2 days. (d) Real-time RT-PCR results of gene expression levels at day 6 in 3T3-L1 adipocyte. Cells were treated with PPT (50 μM) and differentiated for 6 days. Control: growth medium. I+D: insulin and dexamethasone. I+D+R: insulin, dexamethasone and rosiglitazone. Mouse beta-actin was used as the control and values representing mRNA of the untreated cells were defined as 1. Data are presented as means ± SEM (n = 3). *P<0.05, **P<0.01.

