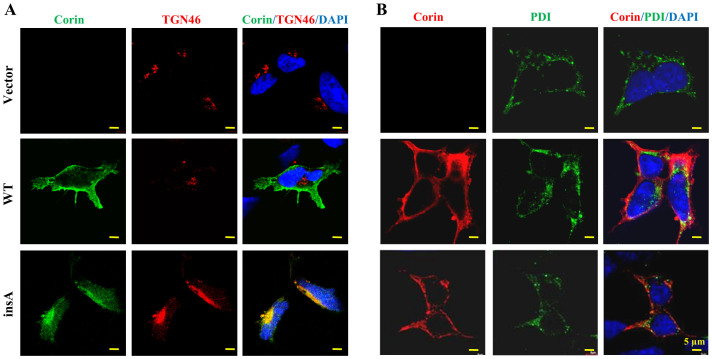
Figure 5. Subcellular distribution of corin proteins.
(A) HEK293 cells expressing WT and the insA variant were stained for corin (green) and TGN46, a Golgi marker (red). (B) HEK293 cells expressing WT and the insA variant were stained for corin (red) and PDI, an ER marker (green). In both experiments, cell nuclei were stained with DAPI (blue) and vector-transfected cells were used as a negative control. Bar: 5 μm.

