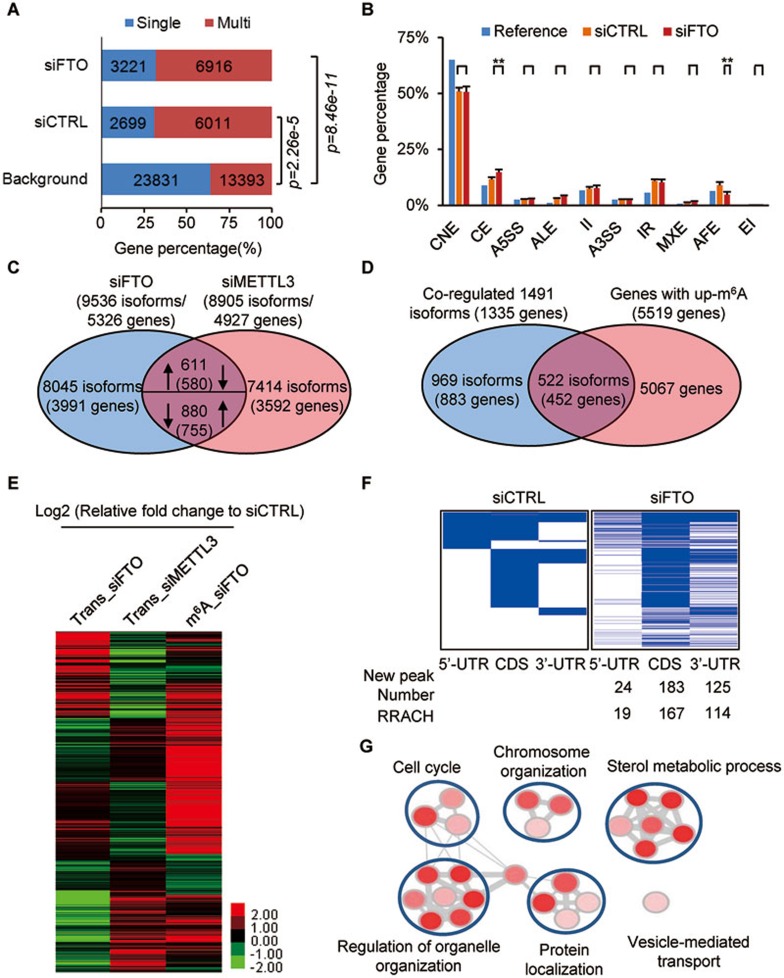
Figure 2.
FTO affects RNA splicing via modulating m6A. (A) The percentage of m6A-mRNAs in control (6 011 multi-isoform/2 699 single-isoform, P = 2.26e-5, Fisher test) and FTO-knockdown cells (6 916 multi-isoform/3 221 single-isoform, P = 8.46e-11, Fisher test) derived from single-isoform or multi-isoform genes compared to the distribution predicted by the Ensembl-annotation reference (background). (B) The distribution of m6A-containing exons across different categories of splicing events in both control (orange) and FTO-depleted samples (red) compared to that Ensembl-annotation reference (Blue). P value for each category was calculated between siCTRL and siFTO samples. **P < 0.01 (Student's t-test) is considered significant (n = 2). Results are shown as mean ± SD. CNE, constitutive exon; CE, cassette exon; A5SS, alternative 5′ splice site; ALE, alternative last exon; II, intron isoform; A3SS, alternative 3′ splice site; IR, intron retention; MXE, mutually exclusive exons; AFE, alternative first exon; EI, exon isoform. (C) 1 491 isoforms (1 335 genes) are co-regulated by FTO and METTL3. Arrows pointing up/down indicates up/down-regulation. (D) FTO depletion resulted in increased m6A levels in 522 isoforms (452 genes) of the 1 491 isoforms (1 335 genes) co-regulated by FTO and METTL3 (shown in C). (E) The heatmap shows the expression levels of 522 reverse-regulated isoforms by FTO and METTL3, as well as the m6A modification in FTO-depleted cells. (F) The heatmap shows m6A peaks in 5′-UTR, CDS, and 3′-UTR (522 isoforms co-regulated by FTO and METTL3) in control and FTO-deficient cells. Blue lines represent m6A peaks. Each horizontal line represents one gene. The number of new m6A peaks upon FTO depletion and new m6A peaks within a RRACH motif are shown below the heatmap. (G) Function enrichment analysis of 522 isoforms (452 genes) based on the DAVID GO analysis result. The cutoff parameters for enrichment analysis with Cytoscape software are: P < 0.005, FDR q < 0.1, overlap cutoff > 0.5. See also Supplementary information, Figures S2-S4.

