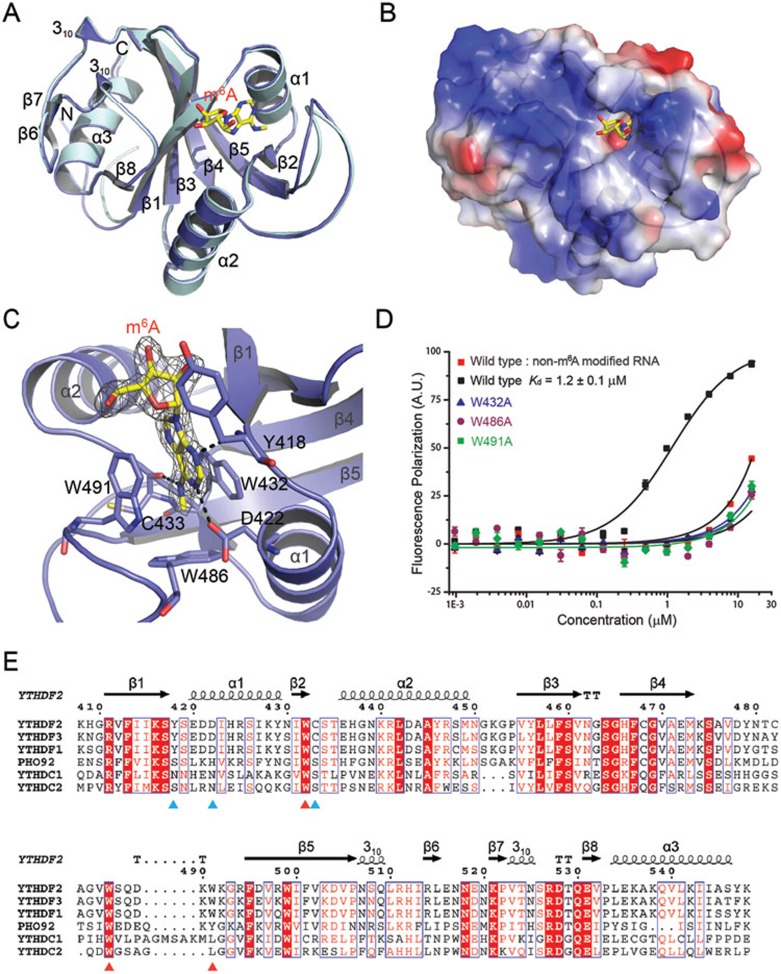
Figure 1.
Structure of YTH-YTHDF2 in complex with an m6A mononucleotide. (A) Structural superimposition of free (colored in palecyan) and m6A-bound YTH-YTHDF2 (colored in blue) structures. The m6A mononucleotide is shown in yellow stick. (B) Electrostatic potential surface of YTH-YTHDF2 in complex with the m6A mononucleotide. (C) Detailed interactions between YTH-YTHDF2 and the m6A mononucleotide. The weighted 2Fo-Fc electron density map of m6A is shown. (D) FP assays of wild type and mutants of YTH-YTHDF2 incubated with m6A-containing RNA probe or unmethylated RNA probe. (E) Sequence alignment of the YTH domains of Homo sapiens YTHDF1-3, YTHDC1 and YTHDC2, and S. cerevisiae PHO92. Residues forming the aromatic cage are indicated with red triangles and residues involved in hydrogen bond interactions with m6A are indicated with cyan triangles. The structure figures were prepared with PyMOL.

