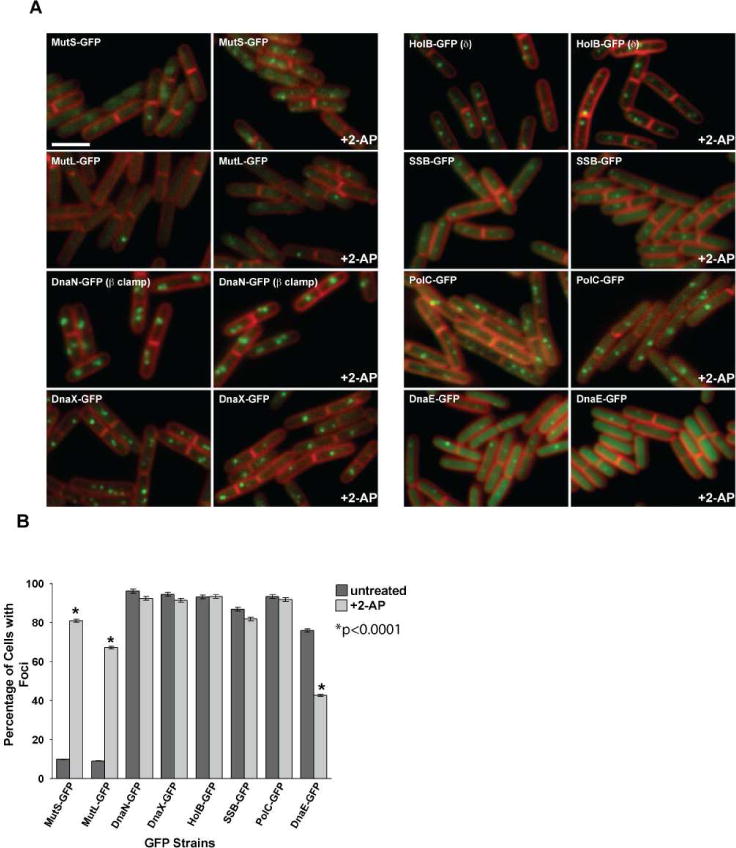
Figure 1. DnaE-GFP foci decrease following mismatch insertion.

(A) Representative images of MMR proteins MutS-GFP and MutL-GFP and replication proteins DnaN-GFP (β clamp), DnaX-GFP, HolB-GFP (δ), SSB-GFP, PolC-GFP and DnaE-GFP are shown untreated and following 2-AP challenge. In each case, the panel on the left is untreated and the panel on the right shows cells challenged with 2-AP. The membrane is stained with the vital membrane stain FM4-64. The bar indicates 3 μm. (B) Scoring of the percent of cells with foci untreated (dark grey bars) and following 2-AP treatment (light grey bars). The error bars reflect the 95% confidence interval. The asterisk indicates the results are significant with p<0.0001. The bar graph represents a summary of the complete data set presented in Table 2.
