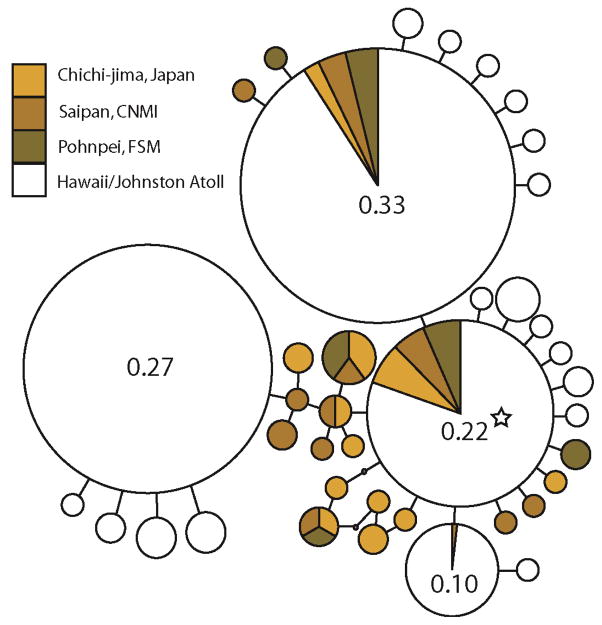
Figure 2.
Statistical parsimony network for Yellow Tang. Area of circle is proportional to the frequency of the respective haplotype (exact frequencies provided for the most common haplotypes), with the smallest circles representing haplotypes found in only one fish. Colors represent haplotype location (see key). Star indicates the putative ancestral haplotype, as identified by TCS analysis.

