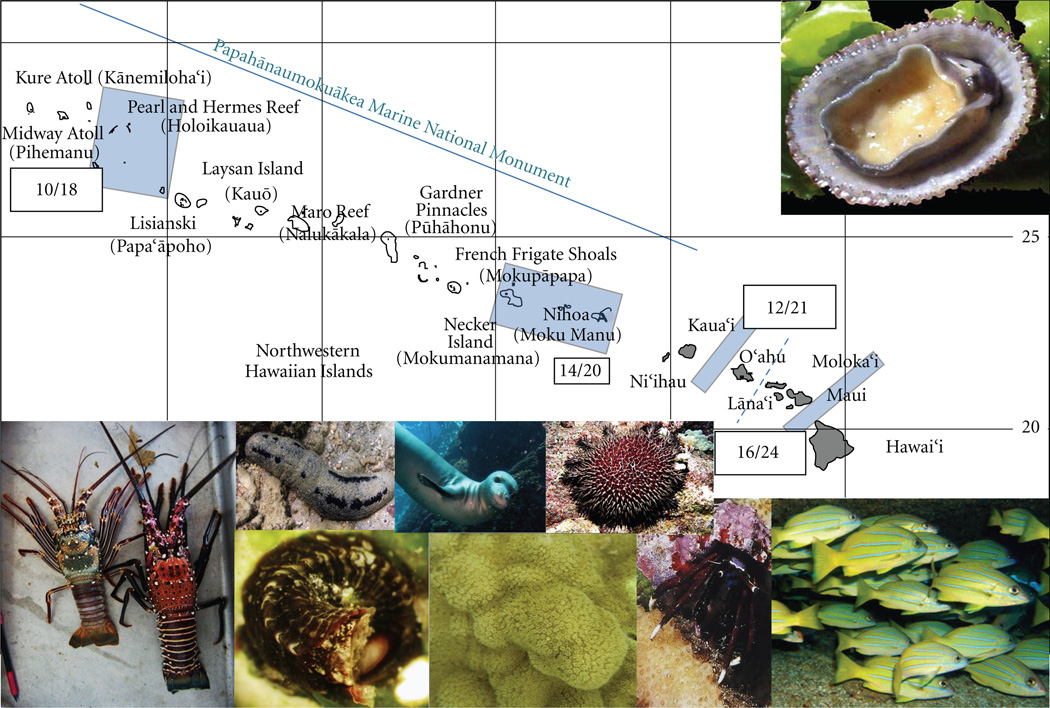
Figure 2.
Map of the Hawaiian Archipelago with significant consensus genetic breaks among the 27 taxa listed in Table 1 overlaid as blue bars between islands. In each bar, the number of species that show evidence for restricted gene flow across the barrier is listed in the numerator, and the total number of species for which we have data across that geographic area is listed in the denominator. The total number of sites included for each species is variable because not all species have been collected or analyzed at each site. The dotted line between Maui Nui and O’ahu highlights the location of the barrier that is shared by 8 of the surveyed species but is not significantly different than random expectations. The images include some of the species included in these analyses (left to right): Panulirus penicillatus, Panulirus marginatus, Holothuria atra, Dendropoma rhyssoconcha, Monachus schauinslandi, Porites lobata, Acanthaster planci, Calcinus hazletti, Lutjanus kasmira, and Cellana sandwicensis (photo credits to Derek Smith, Joe O’Malley, and the authors).

