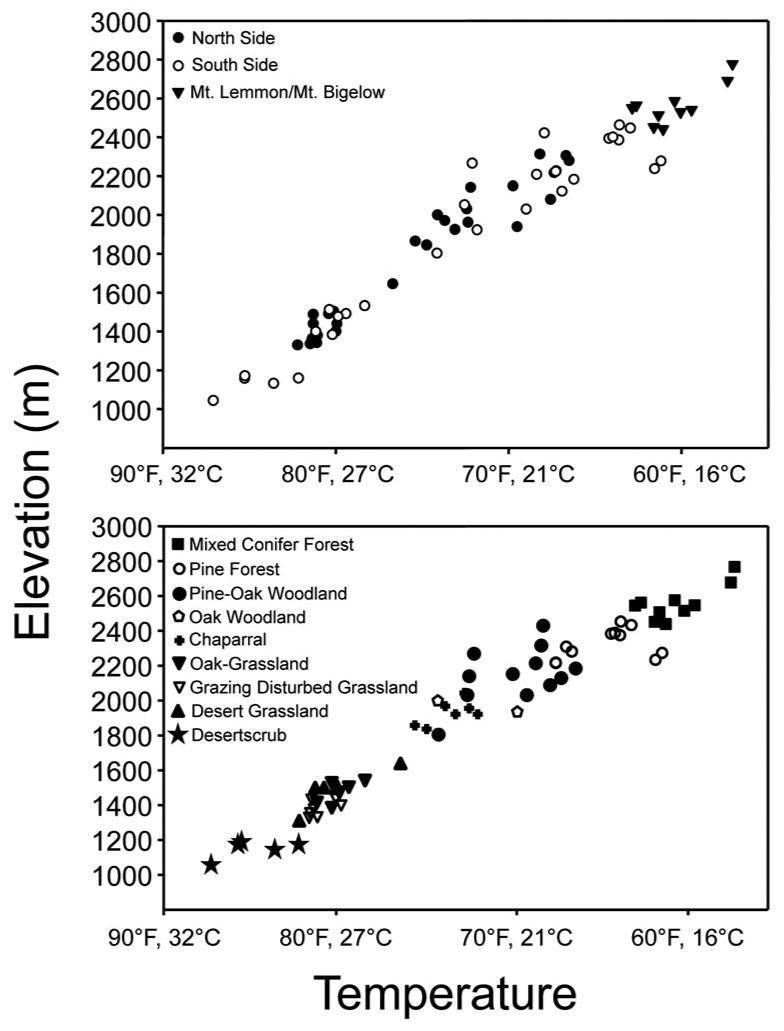
Figure 3.

Average summer temperatures collected 7-May-2011 to 14-Sept-2011 along the transect elevation gradients in the Santa Catalina Mountains. Top: A comparison of average temperatures at sites on the South and North sides of the mountain, as well as those found at the highest elevations on Mt. Lemmon and Mt. Bigelow. Bottom: A comparison of average temperatures at sites in different plant biomes.
