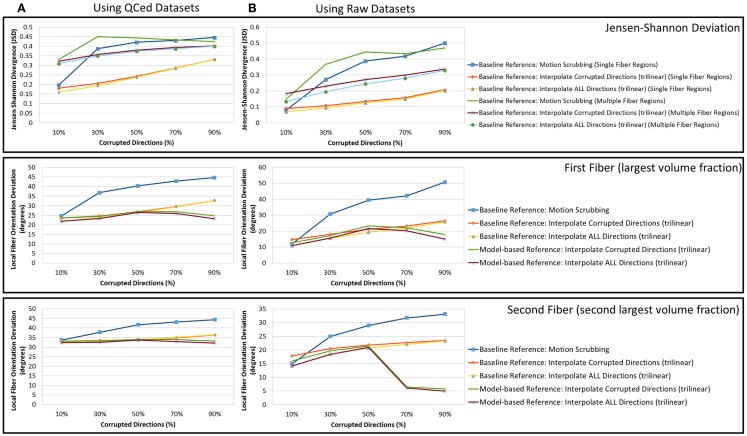
Figure 13.
The average Jensen–Shannon divergence (JSD) values (first row) and the average fiber orientation deviation (second and third row), a function of motion corrupted percentage for reconstructions based on gold standards generated from (A) the QCed phantom dataset and (B) the raw phantom dataset. Note the agreement between (A) and (B) where the impact of motion scrubbing becomes more significant with more motion-corrupted directions when compared to registration-based correction. This effect is also rendered evident for local fiber orientations.

