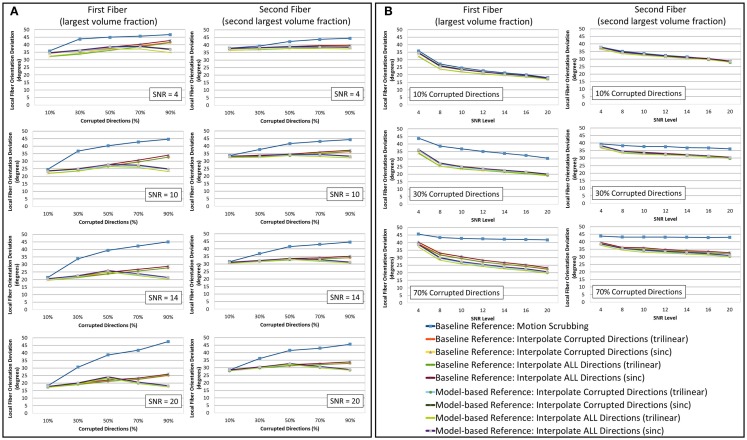
Figure 5.
The average fiber orientation deviation (lower is better) for reconstructions based on raw datasets (denoised ones share similar performance) as (A) a function of motion corrupted percentage for different SNR levels and (B) a function of SNR levels for different motion corrupted percentage. The first and third columns show orientation deviation for the first detected fiber having the largest volume fraction while the second and fourth columns show such values for the second detected fiber having the second largest volume fraction. Notice that local fiber orientations are more affected by motion scrubbing as SNR decreases and/or corrupted directions increase.

