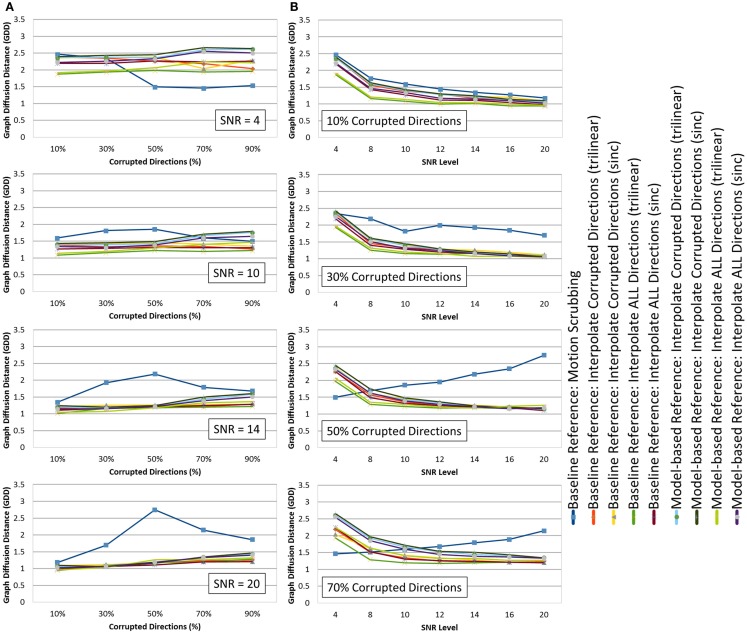
Figure 6.
The average graph diffusion distance (GDD) (lower is better) for the whole brain tractography derived from the raw datasets (denoised ones share similar performance) as (A) a function of the corrupted directions percentage for different SNR levels and (B) a function of SNR levels for different motion corrupted percentages. Notice the different behavior displayed by motion scrubbing for ≥50% corrupted directions, which due to having more short tracts connecting nearby region of interests while being assigned to larger weights in the graph construction step.

