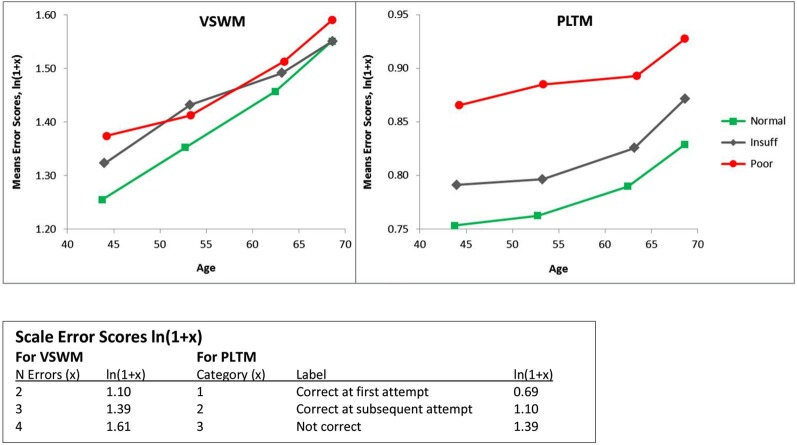
Figure 1.
Mean error scores (ln(1 + x)) plotted as a function of age and hearing according to Dawes et al. (2014), called Hear, with categories in SRT dB: Normal = < −5.5 Insuff = −5.5 to −3.5, Poor > −3.5). VSWM = The six-pairs picture matching task, PLTM = The prospective memory task. Note that as the x-axis is the actual mean ages in the age-groups, the slopes of the lines between the age-groups are on a comparable scale. This also explains why the y-values are not on the same vertical age-line.

