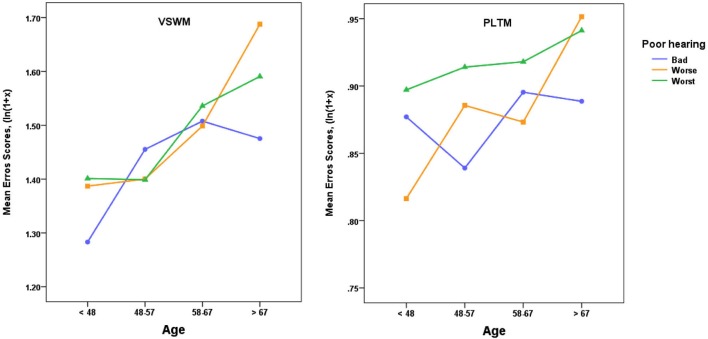
Figure 4.
Mean error scores (ln(1 + x)) plotted as a function of age and three levels of poor hearing, with categories in SRT dB: Bad = > −3.5 to ≤ −3.0, Worse = > −3.0 to ≤ −1.0, Worst = > −1.0. VSWM = The six-pairs picture matching task, PLTM = The prospective memory task. For VSWM there was only a significant effect of Age (see text) and for PLTM there was a significant difference between the Bad and Worst groups, one-tailed t(789) = 1.78, p < 0.05.

