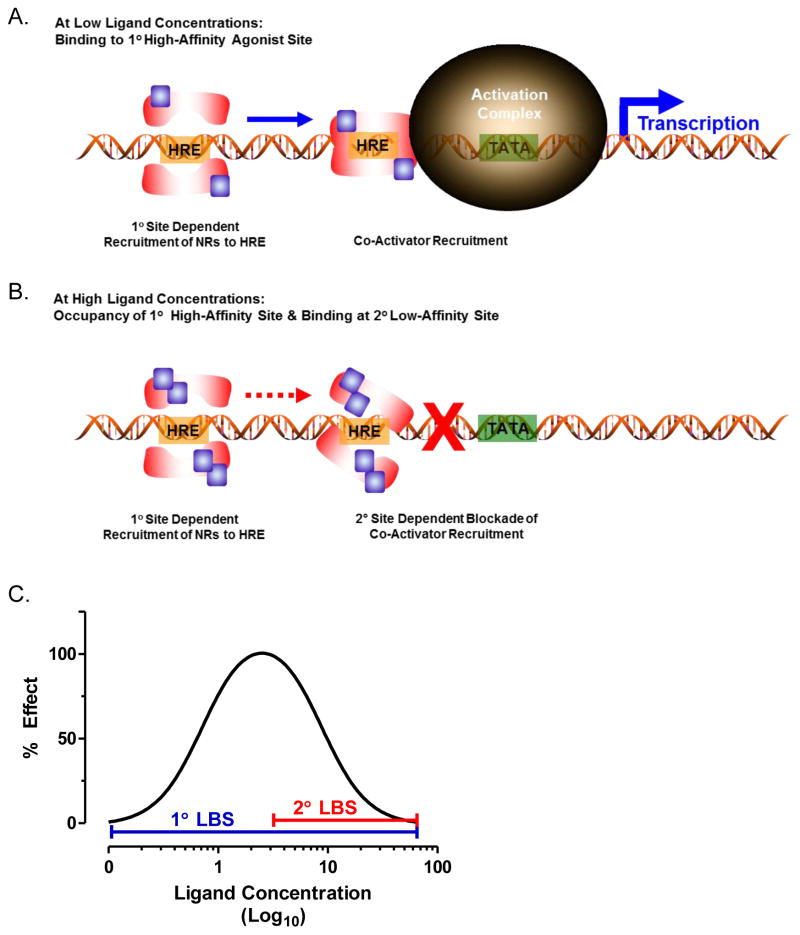
Figure 2. Two ligand binding site model contributing to complex C/R relationships in response to NR ligands.
(A) Ligand (blue square) binding to the high affinity primary site results in receptor dimerization, binding to the hormone responsive element (HRE), and recruitment of co-activators to increase responsive gene transcription. (B) Ligand binding to the high affinity primary site induces recruitment of the NR to the HRE, and ligand binding to the low affinity secondary binding site within the co-activator groove blocks the recruitment of co-regulators, thereby preventing modulation of gene transcription. (C) Idealized concentration response curve based on the hypothetical binding of a single ligand to a high affinity stimulatory ligand binding site and a low affinity inhibitory binding site. The concentration range of the agonist effects of the high affinity site to the C/R curve are indicated by a blue line and the impacts on the curve of the low affinity inhibitory site are indicated with a red line.

