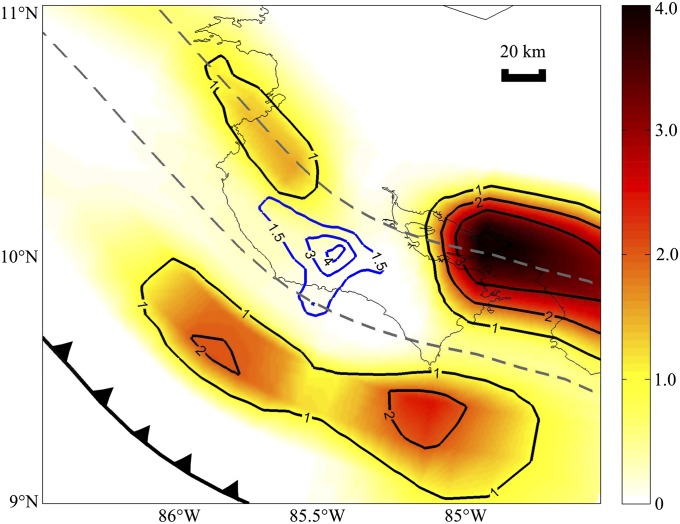
Fig. 4.
Summed SSE slip on the plate interface (black contours in meters, yellow, orange, and red colors) for the entire (1950–2012) interseismic period, assuming the 2007–2012 measurement period is typical. For comparison, the patch that ruptured in the 2012 earthquake (19) is also shown (in center, blue contours in meters).

