Fig. 4.
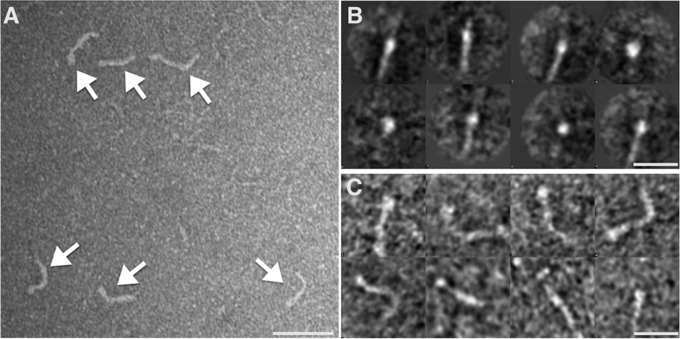
Negative stain TEM of NadA3. (A) Elongated structures corresponding to negatively stained NadA3 are indicated by white arrows. (Scale bar, 50 nm.) (B) A set of representative class averages (∼10 images per class) of NadA3 is shown. Some of the class averages, presenting side views, show an elongated structure with an enlarged terminus. (C) Single particles bandpass-filtered showing different degrees of curvature are shown. (Scale bars, 20 nm in B and C.)

