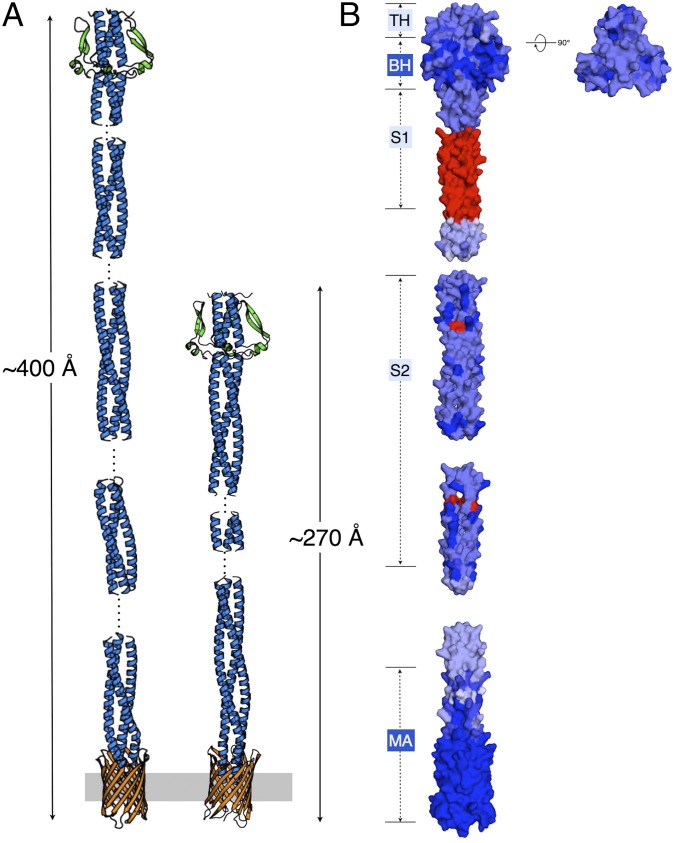
Fig. 5.
Full-length models of NadA3 and NadA5 displaying sequence conservation. (A) Models of NadA3 and NadA5 are shown as cartoons; the stalk is shown in blue, the wing-like insertions of the head domain are shown in green, and the transmembrane anchor is shown in orange. The outer membrane where NadA is anchored is shown as a gray bar. Dashed lines indicate either regions missing in the crystal structure of NadA5 or regions with low sequence homology or unknown secondary structure that were not included in the models. (B) The sequence conservation between NadA3 and NadA5 is mapped onto the surface of the model of NadA3 using a gradient of blue from low (light blue) to high (dark blue). Red surface patches indicate sequence insertions in NadA3 that are missing in NadA5 and thus were omitted from the sequence-conservation analyses. Light- and dark-blue boxes show regions of medium and high conservation, respectively, as described in the main text. The representation in B was generated using ProtSkin (40). BH, basal head; MA, membrane anchor; S1, stalk1; S2, stalk2; TH, top head.

