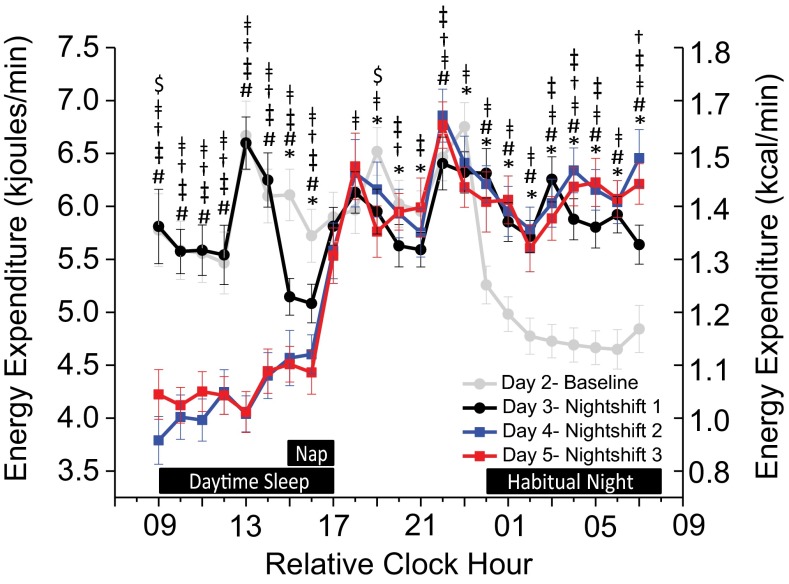
Fig. 2.
Hourly energy expenditure across the simulated shiftwork protocol (n = 14; P values, planned comparisons for day, two-tailed). The gray line represents day 2 (baseline), the black line is day 3 (nightshift 1), the blue line is day 4 (nightshift 2), and the red line is day 5 (nightshift 3). Black boxes along the x axis indicate scheduled sleep opportunities (day 2 nighttime, day 3 nap, days 4–5 daytime). *Differences between baseline and nightshift 1; #differences between baseline and nightshift 2; ǂdifferences between baseline and nightshift 3; †differences between nightshifts 1 and 2; ‡differences between nightshifts 1 and 3; $differences between nightshifts 2 and 3; P < 0.05. Error bars are SEM.

