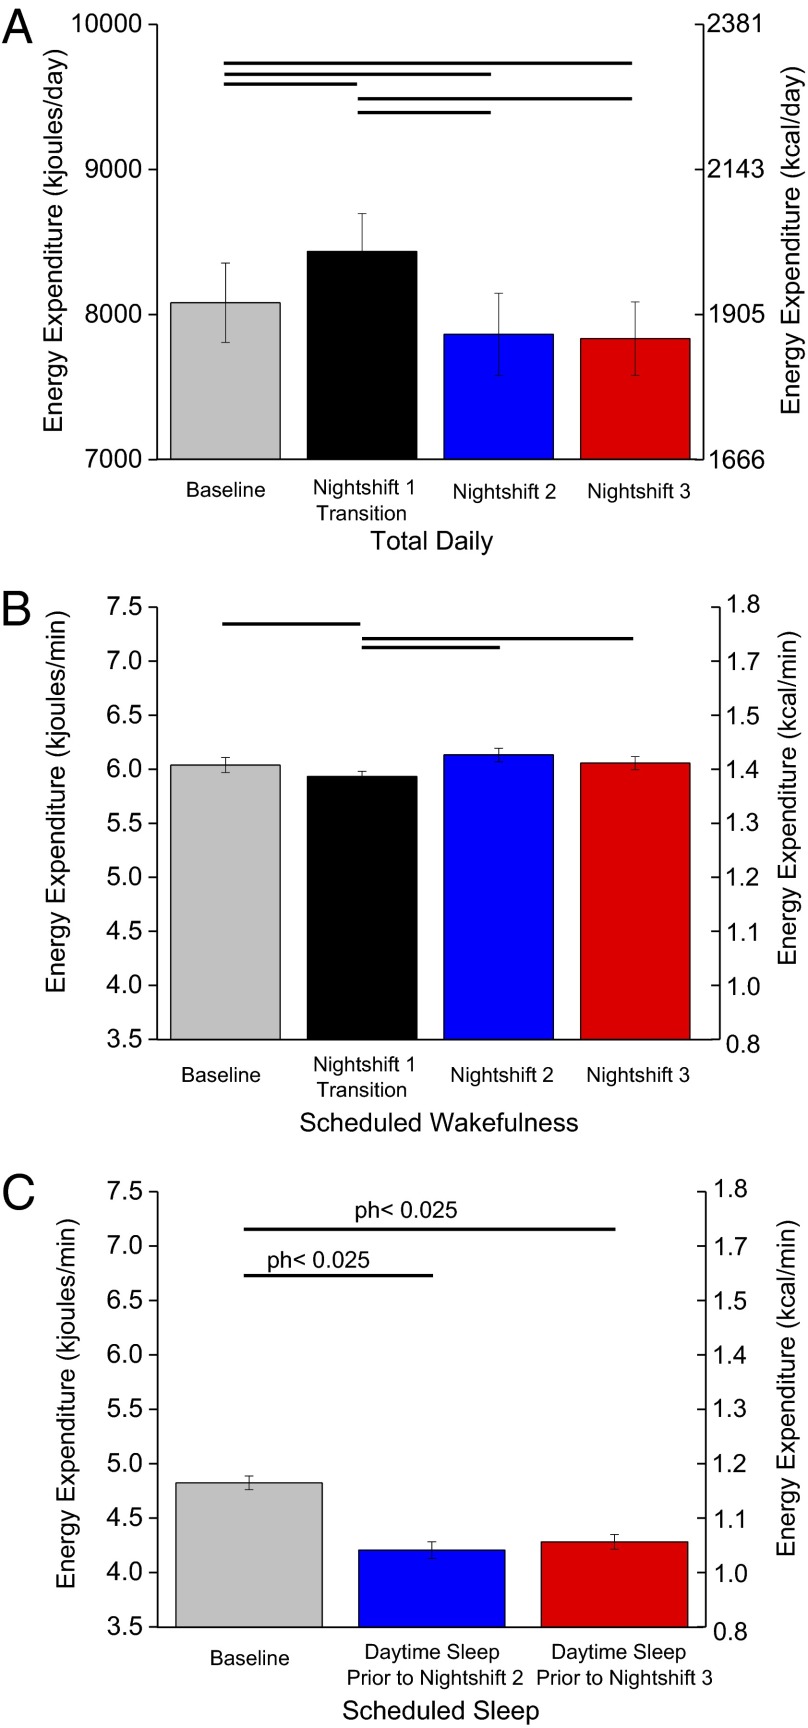
Fig. 3.
Total daily (24-h) (A) and scheduled wakefulness (B) and sleep (C) energy expenditure (n = 14; P values, planned comparisons for day, two-tailed). Solid lines represent significant differences at the end of each line (modified Bonferroni, P < 0.025). Exploratory post hoc (ph) two-tailed P values are shown for scheduled sleep EE, as findings were in the opposite direction of that hypothesized. Error bars are SEM.

