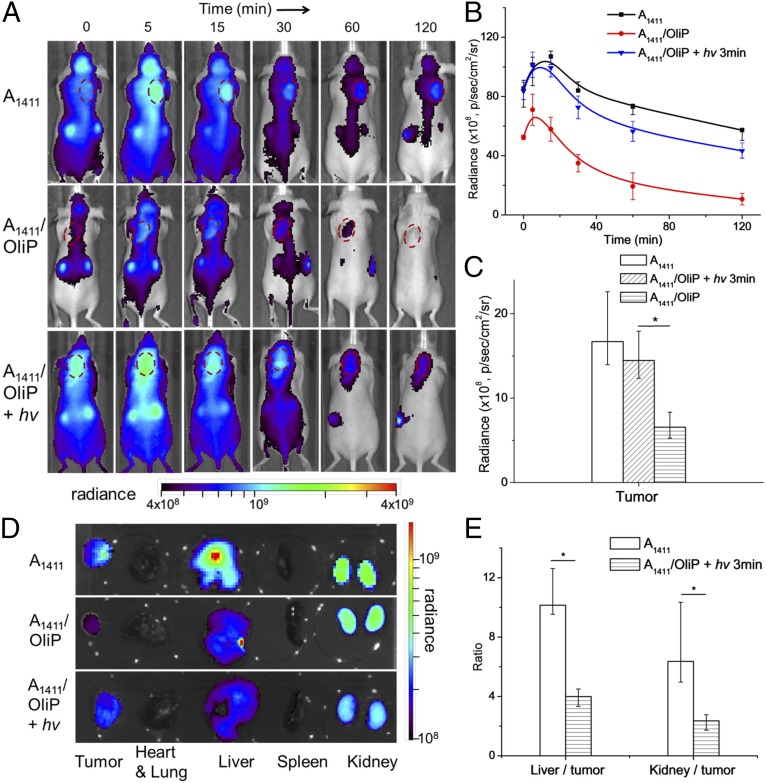
Fig. 6.
Effect of light triggering of A1411/OliP on biodistribution. (A) Representative whole-body fluorescence images of 4T1 tumor-bearing mice injected i.v. with Cy5-labeled A1411 or A1411/OliP without or with subsequent irradiation at the tumor site (365 nm light at 200 mW/cm2 for 3 min). Tumors are indicated by red dashed circles. (B) Time course of intratumoral Cy5 fluorescence over 2 h, derived from integration of the photoradiance [photons per second per square centimeter per steradian (p/s/cm2/sr)] in A. n = 5. (C) Intratumor accumulation of Cy5 2 h after injection. Data are medians ± quartiles (n = 5). Asterisk indicates P < 0.05. (D) Representative fluorescence images of organs and tumors 2 h after i.v. injection. (E) The ratio of photoradiance in livers to that in tumors and kidneys to tumors for mice that received A1411 or A1411/OliP with irradiation. Asterisks indicate P < 0.01 (n = 5 for all groups). Numeric data are medians ± quartiles.

