Fig. 4.
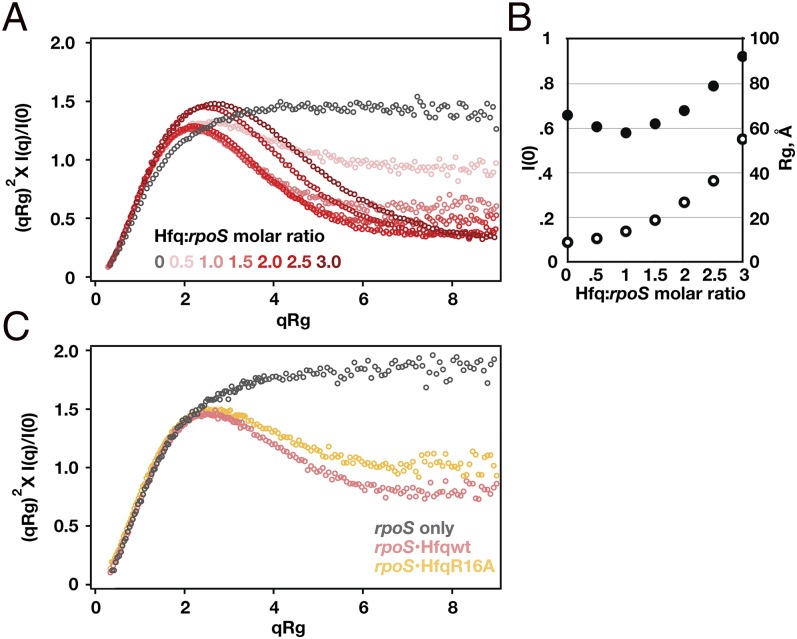
SAXS of rpoS•Hfq complexes reveals a compact structure. (A) Dimensionless Kratky plot (31) of SAXS profiles for rpoS RNA alone (black) and rpoS•Hfq complexes at increasing protein:RNA ratios (pink to red). Bell-shaped curves indicate compact structures. See Fig. S4 and Table S2 for further data. (B) Hfq binding increased I(0) (open circles) and decreased Rg (solid circles) compared with free rpoS RNA. At 1:1 mol ratio, ∼95% of RNA is bound to Hfq. Correction for scattering from the free RNA and protein reduces the experimental Rg of the complex by ∼1 Å. (C) Kratky plots of rpoS RNA alone (black), with 1:1 WT Hfq (pink) and with 1:1 Hfq:R16A (gold).

