Fig. 6.
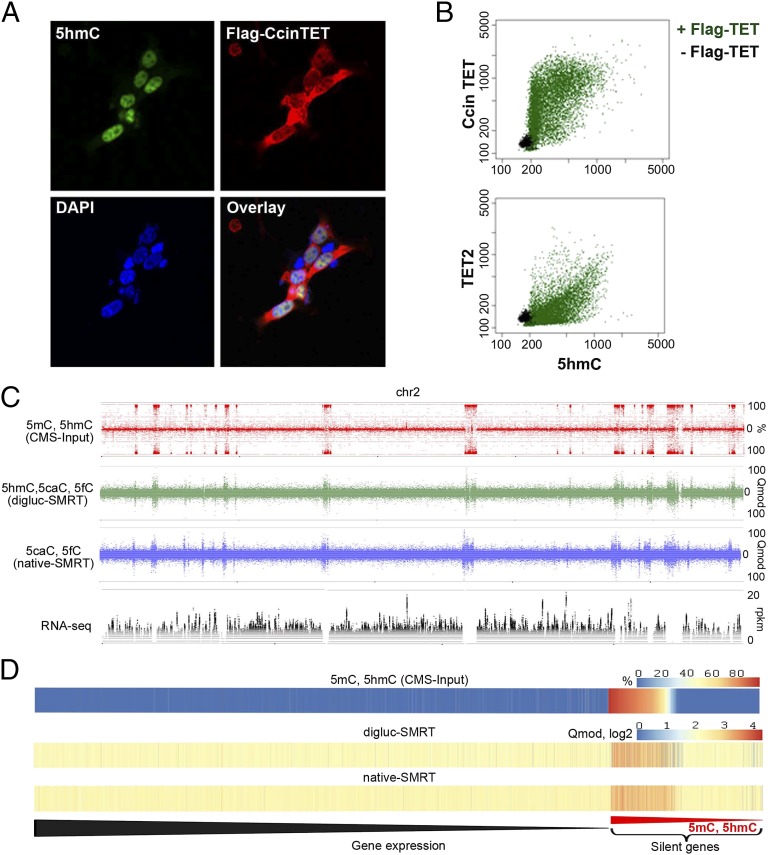
Catalytically active TET/JBP gene and relation of DNA modifications to gene expression. (A) Immunostaining of FLAG-CcinTET and 5hmC. HEK293T cells were transfected with pEF-Flag-CcinTET. 5hmC and CcinTET levels were detected by rabbit anti-5hmC (active motif) and mouse anti-Flag (Sigma) antibodies, followed by Alexa Fluor 488 goat anti-rabbit IgG (green) and Alexa Fluor 647 goat anti-mouse IgG antibodies (red). The nuclei were stained with DAPI (blue). (B) Use of IXM high-content imaging system to examine the catalytic activity of CcinTET in HEK293T cells. Each dot indicates the intensity of 5hmC and CcinTET expression (Flag-positive cells) of a single cell (22,248 cells analyzed). Green indicates HEK293T cell expressed with pEF-Flag-CcinTET; black indicates HEK293T cell expressed with empty vector. (C) Complete strand separated data representation of (from top to bottom) bisulfite (CMS-Input)-derived modifications (5mC and 5hmC), digluc-SMRT, native SMRT sequencing (assessed by Qmod values), and RNA-seq data coverage at 10-bp windows along the full chromosome 2. Note the complete coincidence of oxi-mC and 5mC-enriched regions and the strong suppression of transcription in regions of heavy 5mC/oxi-mC. (D) Heat maps of mean 5mC/5hmC (CMS-Input), digluc-SMRT, and native-SMRT signals per gene in oidia, sorted by gene expression in oidia from high to low. Elevated mC/oxi-mC signals are predominantly observed at silenced genes (Right). Silenced genes are sorted from high (at left) to low (at right) 5mC/5hmC level.

