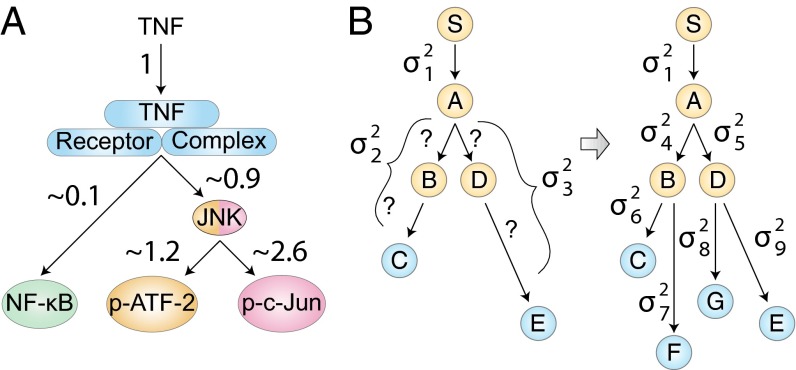
Fig. 4.
(A) TNF signaling network noise normalized to the noise that is contributed by the common TNF–TNFR segment, based upon the data in Fig. 3 B–D. The map demonstrates asymmetry in the amount of noise contributed by the NF-κB and JNK pathways and shows that the majority of noise in the JNK pathway is contributed downstream of the TNF receptor complex. (B) Illustration of a noise decomposition of a larger network. Given a hypothetical signaling network of six nodes and two readouts (C and E), only three noise values can be ascertained. With the addition of two new readouts (F and G), a more comprehensive noise decomposition map can be constructed that can guide further investigations.

