
Figure 3. Nuclear localization of YAP/TAZ downstream of integrin αv following mechanical stimulation.
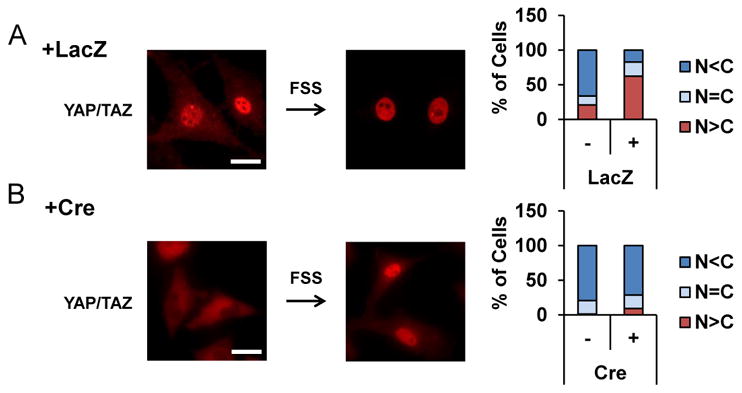
Nuclear localization of YAP/TAZ following FSS in control osteoblasts (A) was impaired in integrin αv -deficient osteoblasts (+Cre in B). YAP/TAZ was visualized at 30 min after FSS by immunofluorescence using an anti-YAP antibody that also recognizes TAZ (Red). Scale bars, 25 μm. (right) % of cells with predominant nuclear (N>C, red) or cytoplasmic (N<C, blue) staining was quantified in more than 100 cells each group.