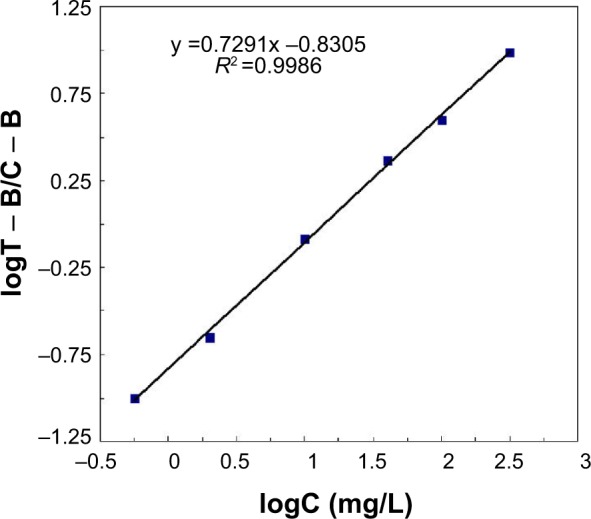
Figure 4.

Calibration curve was obtained from log(T – B/C – B) (y axis) and logC (x axis) for calibration samples ranging from 0.5 to 300 mg/L.
Notes: T indicates FL intensity of test lines; B indicates baseline; C indicates C-reactive protein concentration, mg/L.
